In higher education, early warning systems have become more commonplace for the identification of students who may need assistance at an opportune time in their academic or institutional journey. But leaving aside the performance of the model on the whole, is it able to make good classification decisions about the small population of students who do drop out? This study reviews this distinction by critical evidence synthesis and secondary quantitative reanalysis of published supervised-learning results, especially in the context of Bangladesh in higher education. Two published studies were independently reconstructed with the positive event being the aggregate labelled with source since these studies were conducted after the 1986 PISA study. The following values were computed: drop out recall, precision, F1 score, balanced accuracy, overall accuracy, volume of alerts, and Wilson 95% confidence intervals. Further sensitivity analyses were conducted for decision robustness: error cost, review capacity and prevalence.
In the primary Bangladesh scenario, the performances of the three classifiers, that is, LWL, Naive Bayes, and PART, were 86.36%, 86.36%, and 86.36% accuracy, respectively, but only detected 1, 2, and 6 out of 10 cases of dropout from sources, respectively. The minority class detection scores (dropout-oriented F1) were 18.18%, 30.77%, and 57.14%, showing that similar accuracy can hide quite different minority class detection accuracy. With small event denominator, the dropout recall and precision of PART were 60.0% and 54.55%, respectively, with a high level of uncertainty. Finally, in error-cost and institutional review-capacity scenarios, it was demonstrated that model preference shifts with the explicit inclusion of the relative consequences of missed cases and false alarms.
Results highlight the need to think beyond the accuracy-based model selection to minority-event evaluation, uncertainty, alert burden and the constraints of operational decisions when evaluating a drop-out early-warning system. The study provides an auditable framework for evaluating instead of a new predictor. To be able to be deployed in Bangladesh, predictors need to be time-stamped, dropout outcomes need to be independently verified, probability need to be calibrated, external validation should be available, adequate review capacity should be available, and the student should evaluate the subsequent support interventions.
An early warning system in higher education should recognise the early signs of difficulty in a student and provide an appropriate time to act. One piece of that system is a classifier which labels historical records properly. The usefulness of the exercise also would be affected by how one defines difficulty, the time at which information is made available, who is paid attention to, and whether or not an institution can provide them with any assistance. Research on EDM has built a wide range of classification techniques and literature reviews have separated the ability of analytics to predict from evidence of analytics as a support to study success (Agrusti et al., 2019; Ifenthaler & Yau, 2020; Romero & Ventura, 2020).So the question is not just which algorithm has the highest score, but rather, which evaluation enables an actionable and defensible warning.
That's particularly important if the event of interest is not very common. A model can correctly classify most of the continuing students, but miss many of the students that will be labeled dropouts. An average accuracy is calculated over the two groups and is only meaningful if the positive class is specified when reporting an F1 score. It can then be decided to advice based on majority class score, which can then lead to a rule that gives virtually no warnings. But I don't mean to imply that I'm against supervised learning. The alignment of the statistical target with the educational purpose is required. The same applies to the binary evaluation, as shown in the following examples, where the accuracy or F1 results are quite good, but the confusion matrix is different in both cases.This also applies to binary evaluation as in the following examples, where the accuracy or F1 are good, but the confusion matrices are different.
Bangladesh is an appropriate context to investigate this problem, but local relevance needs to be proved and not presumed based on the authors' affiliations. A supervised classifiers (Akter et al., 2024; Department of CSE, Daffodil International University, Dhaka, Bangladesh. et al., 2019a) have been studied in published works in Bangladesh predicting dropout from university and predicting postgraduate continuation. Prior research reports issues with online learning experiences and unequal access to technologies for learning online for Bangladeshi university learners (Dey, 2023; Islam & Habib, 2022).The strands indicate a possible need for early intervention support, but are not identical. A validated label of withdrawal is not provided by digital-access surveys and a dropout classification paper does not necessarily indicate prospective lead time or successful intervention. It is important for a credible local system to link these types of evidence together but not use one in place of the other.
Students' persistence is also not the same as institutional retention. A learner may stop study, transfer or postpone doing a postgraduate programme or withdraw from a programme that no longer meets their aims. Student centred focus is on motivation, belonging, self-efficacy, and perceived educational value (Tinto, 2017).Those factors make it prudent to not rule out the possibility of non-continuous enrolments. An early warning should not be a pass to the belief that there is no commitment; it is a call to discuss support and options. The purpose of the substantive role proposed here is timely, proportionate support for students who are facing avoidable barriers, while maintaining students' agency.
The current study tests the feasibility of what can be supported with the available evidence. The learner-level institutional records and prediction probabilities were not available to develop independent models. The empirical contribution is an auditing study that is replicable. The primary source provides an evaluation of a small Bangladeshi database with three classifiers all of which achieve the maximum accuracy, and selects the best model using enrolment-oriented F1. The former prediction can be reversed to a test of whether the reported ranking has a dropout-warning function. The reporting consistency and minority detection are compared as a bounded comparison in a separate published evaluation, rather than to validate the Bangladesh models.
The gap clarified is specific: the steps between published supervised summaries of texts and evaluation based on the context of a text is not explicit in the evidence that was chosen. Class imbalance, calibration, and ethical learning analytics are not new problems as addressed in this paper. Its role is to make their outcomes measurable in a local, numerical case; to provide the ability to recreate counts without having to create individual cases; and to demonstrate the impact of operational hypotheses on the interpretation of an apparent performance tie. The analysis distinguishes between source quantities confirmed, algebraic re-calculations and hypothetical decision situations. This separation is a critical one as it is essential to the review capacity assumption being able to create an actual advising benefit.
The study is organised in 4 questions. RQ1 aims to understand how the comparisons between classifiers change when dropout as opposed to enrolment is considered as the positive event. The tables include all minority class detection, false-alert burden, and uncertainty that can be recovered from the tables. RQ3 is whether the preferred operating rule is robust to explicit error-cost, review-capacity, and prevalence assumptions. RQ4 is: What further evidence would a Bangladeshi institution need for turning these findings into a potential early warning service? Completed aggregate data analysis is used to answer the first three questions, and the fourth results in a proposed validation and governance framework. None are stated as a cause and effect question about whether or not machine learning can prevent dropouts.
2. Literature review and conceptual foundation
2.1 Prediction, persistence, and the definition of an early warning
A supervised dropout predictor is a machine that learns the relationship between the features that are available and a labeled educational outcome. This simple formulation hides a number of different targets: failure of a course, failure to re-enrol for another semester, dropping out of a programme or failure to achieve a qualification. This diversity can be seen in published data sources. While the Open University Learning Analytics dataset correlates registrations, assessments and learning-platform interactions, the dataset Realinho and colleagues describe differentiates between dropout, continued enrolment, and graduation (Kuzilek et al., 2017; Realinho et al., 2022).These provide useful examples for the definition of records and outcomes, but do not provide any numerical observations for the present analysis.
An early warning additionally requires an index time and a prediction horizon. A feature can be admitted only if it can be used when the warning is issued. End of semester performance could be beneficial for next semester support but it is not possible to make it a predictor for admission time. Likewise, a final status can be a result but not a suitable input. The need for explicit leakage documentation is supported by general research on leakage (Kapoor & Narayanan, 2023). Lack of adequate reporting does not constitute evidence that a source leaked information; rather, it is a lack of establishment of the early-warning claim.
The algorithm should be developed before the educational construct. This can lead to the same administrative records resulting from a temporary interruption in the learning process due to a remediable barrier and a planned transition to employment, while also necessitating different responses. The distinction Tinto draws between institutional retention and students' persistence is helpful when considering a service model that asks, "What is the learner trying to accomplish? (Tinto, 2017).In this context prediction signals a potential need for review, and human engagement indicates support's appropriateness. The present reanalysis does not do a "retroactive reclassification" of all noncompletion as preventable withdrawal, but keeps the original binary labels.
2.2 Why model rankings depend on the evaluation target
Common classifiers, neural approaches and progressively more complex ensembles are found in the drop-out literature. Niyogisubizo and colleagues explore the stacked generalisation technique for university classification of dropouts, and Mduma investigates data balancing in the prediction of dropouts (Mduma, 2023; Niyogisubizo et al., 2022).These techniques relate to the learning of a model. The question of the current study is whether or not the interpretation of a published model is in line with the intended service. A model that is technically sophisticated, but poor in terms of the decision-making metric is still a model that is not good for decision-making.
Sensitivity and precision are two institutional questions. The question of "dropout recall" is what proportion of labelled cases are rejected, and the question of "precision" is what proportion of cases is labelled that actually get a warning. They have different denominators and high precision is not the same as wide case detection. Balanced accuracy assigns equal importance to the two measures, sensitivity and specificity; ordinary accuracy assigns weights based on the prevalence of the classes. While both precision and recall are included in F1, there is no institutional basis to give value to a missed case or review. There is no single answer to the question of a support policy (Chicco & Jurman, 2020). The comparison is therefore of the underlying counts and the number of alerts.
Probability calibration is also an additional property. A risk estimate of 0.30 should be comparable (in an appropriate evaluation population) to a 30% event rate. This correspondence is not given by accuracy nor by a confusion matrix at one accuracy threshold. While some basic principles and methods can be also applied to the field of education, calibration is sufficiently well established as well as diagnostic principles. The relevance of these here is methodological in that they give an indication of what has to be measured, rather than what can be derived from the existing tabulation of aggregates. The overall results do not provide any information about prediction probabilities; therefore, there is no possibility for assessing probability calibration here.
2.3 Student support, institutional capacity, and Bangladesh context
Implementation studies situate predictive learning analytics within an organisational process for educators, interpretation, communication and follow-through. Guidelines for deployment at scale and a longitudinal distance-learning case study describe these operational requirements (Herodotou et al., 2019; Herodotou et al., 2020). Previous research investigates the causes of algorithmic mistakes, as conditions not captured in institutional data are explored (Hlosta et al., 2022). A false positive might still be helpful to advise someone, and a true positive does not indicate which intervention would be effective. Prediction and eligibility for services should, therefore, be kept on separate records and be evaluated separately.
A danger lurks in the danger of overinterpreting digital traces in Bangladesh contextual studies. Income and gender gaps in participation are reported in research on online-class experiences, while other research focuses on connectivity, resources, digital skills, and the learning environment (Dey, 2023; Islam & Habib, 2022; Priyo & Hazra, 2021). These results make access conditions reasonable grounds for considering when interpreting low online activity. They do not conclude that this is the reason for drop-out in the current sample. Students with limited platform event may not be engaged, studying away from the platform, use a shared device or may not be connected. These alternative explanations should be retained in a system designed to provide support until the contact or further evidence clarifies them.
Educational algorithmic bias research points to issues that can emerge in the entire process of constructing and using algorithms, and a general machine-learning harm framework distinguishes failures at various stages of the life cycle (Baker & Hawn, 2022; Suresh & Guttag, 2021). Clear, student-centred usage also forms a key part of ethical learning analytics guidance (Rets et al., 2023). These sources can be combined to create three conceptual entry points for the proposed application of Bangladesh: a legitimate and timely target; and an evaluation that identifies who is being left behind and who is being overloaded; and a non-punitive pathway to support that can be measured for its benefits. The second gate will be directly addressed by the empirical analysis below and the information available with respect to the first will be audited. Does not show that the 3rd gate is met.
3. Methodology
3.1 Design and scope of the evidence synthesis
The number of people in the identified evaluation population, a recoverable class orientation, and counts or sufficiently accurate measures to facilitate reproducible calculations were necessary for numerical inclusion. These operating requirements were met with two sources for the current audit. Two contextual studies were conducted in Bangladesh and published in 2024, which were not merged with the quantitative sample for interpretation (Akter et al., 2024)There is no registered review protocol, no independent duplicate screening, no exhaustive export of the database and no PRISMA screening total claimed. This selection is not for the purpose of estimating prevalence of reporting problems across the literature, but rather for the purpose of a methodological case analysis.
3.2 Data sources, provenance, and analytical sample
Academic records and other data from a single survey of 125 graduation cohorts across an anonymous department at a public university in Bangladesh.Academic records and additional survey data from one department at an anonymous public university in Bangladesh. It has five predictors: year of graduation, gender, marital status, job status, graduation result. The paper mentions that 70% of data was used for training and 30% for testing and 66 test records. The term it uses is “enrolment”, “postgraduate completion”, or “dropout”, so in this reanalysis, we use the term “source-labelled dropout/noncompletion” instead of assuming a confirmed future endpoint of dropout (Biswas ,2019)
Source B has five classifiers, 1896 complete training records from 3562 merged records, and a training-test split of 1422:474. It has 474 test labels (389 non-dropout, 85 dropout). The authors' affiliation to Bangladesh does not indicate the country of the student population, and the inspected text does not clarify this. Thus, Source B is a supplemental reporting audit, which can be considered as a second Bangladeshi cohort or an external validation sample (Shohag & Bakaul, 2021). The two sources are never mixed together.
Table 1. Numerical evidence, provenance, and permissible interpretation.
Source and population
Published input
Use and boundary
A: Biswas et al. (2019) Public-university department, Bangladesh; graduation years 2012–2017
7 classifiers; test n=66; Table 2 percentages Five predictors; postgraduate status label
Integer reconstruction and minority-outcome reanalysis No verified prospective withdrawal time; no learner-level records
B: Shohag & Bakaul (2021) Student geography not established; reported records 2015–2016
5 classifiers; test n=474; Table 3 counts 1,896 complete records from 3,562
Separate reporting audit and scenarios Not a second Bangladesh cohort; no pooling
Note. Only these aggregate results enter the numerical analysis. Literature and dataset-description references do not add student observations.
The unit of analysis is the source specific confusion matrix. There are 462 independent learners for the same 66 records evaluated by 7 different algorithms, and 2,370 learners for the 474 records evaluated by 5 different algorithms. No student trajectory, identity or platform log or probability predictions were downloaded. All reports in the original documents are the source of observational evidence; present calculations are only derived summaries.
3.3 Extraction, reconstruction, and audit rules
Accuracy, enrolment recall and source specificity were extracted from Table 2 of Source A and test size and definition of the positive class were extracted from the accompanying text. The reconstruction produced all nonnegative integer confusion matrices that total to 66 and that have two classes in them. A small numerical tolerance was allowed of up to 0.005 percentage point difference between the recalculated percentages and the reported percentages. There was no a priori assumed class support. Only one candidate met these criteria for each classifier. Source F1 and precision were not employed as a means to achieve agreement but instead were retained for an independent discrepancy check.
The four cells for Source B were re-worded from its Table 3 and verified with the source prose and class supports. For summary percentages where there was disagreement with counts, these counts were used as the analytical basis.Where there was disagreement between counts and summary percentages, these counts were used as the analytical basis with the conflicting published percentages remaining in an audit file. It is a clear prioritisation of counts that are internally reconcilable, and therefore not a silent correction of the publication. The retrieval environment did not have the ability to render the original PDF page-image. In the extraction process, therefore, only information from the main text was considered, and texts containing tables and narratives were extracted again. This is also reflected in the reproducibility record and the author verification checklist.
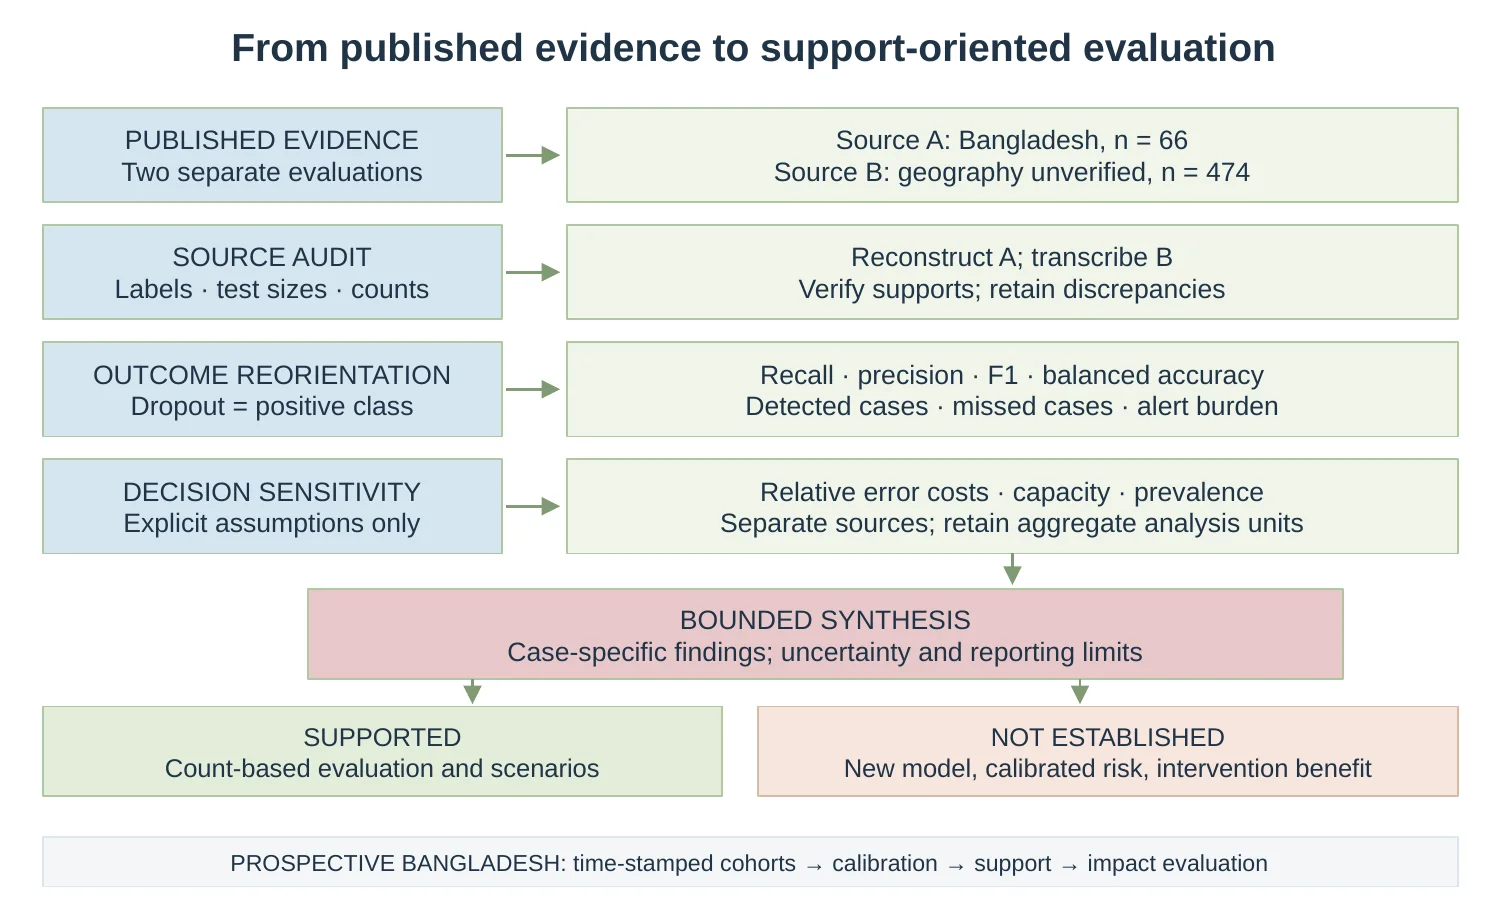
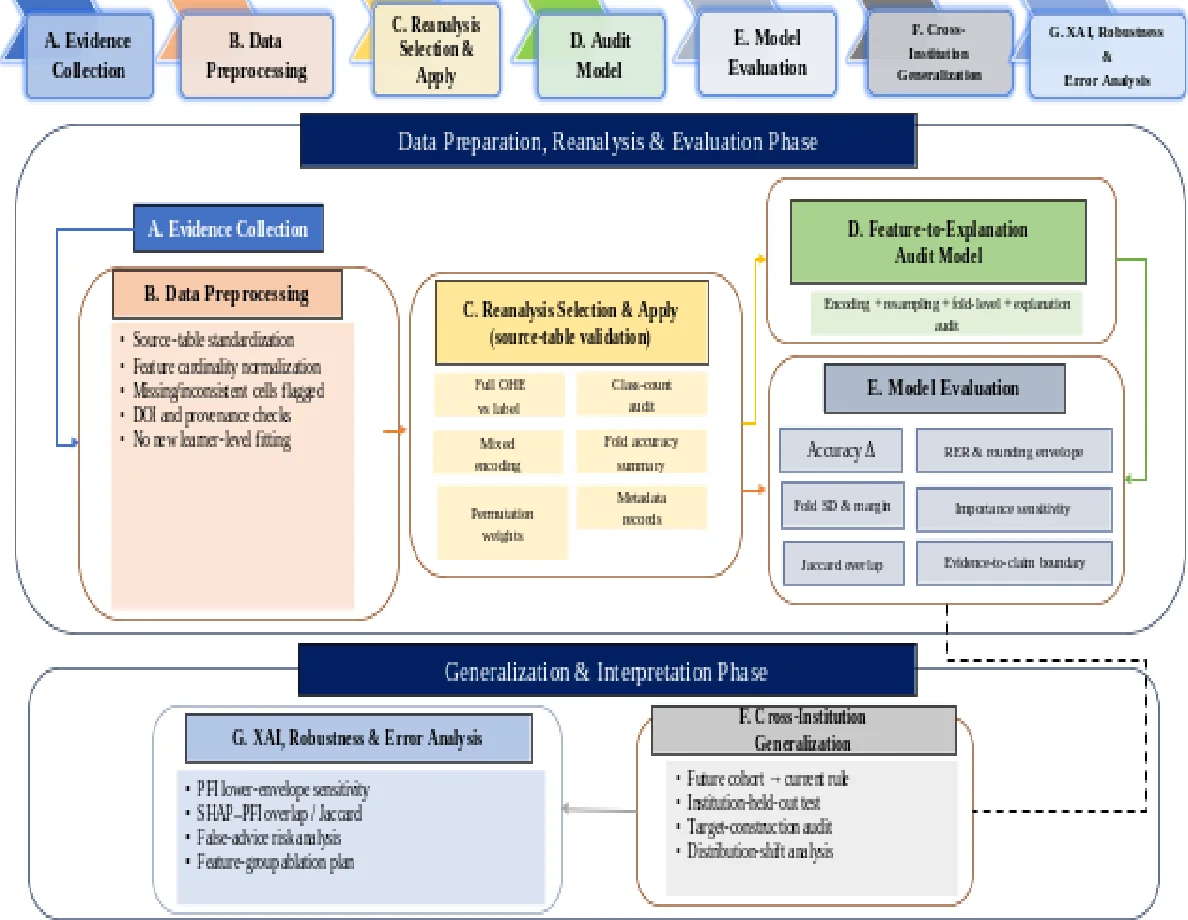
All matrices were then relabelled so that a positive prediction means a dropout warning. This orientation: TP is a warned source-labelled dropout; FN is a missed source-labelled dropout; FP is a warning for a source-labelled, non-dropout; and TN is a correctly unflagged, non-dropout. Relabelling does not alter the meaning of sensitivity, precision and F1, nor does it alter the number of correct classifications or the predicted classes. Records were not created for any individual from the matrices. The completed workflow is summarised in figure 1, and is differentiated from the proposed validation stage.
Figure 1.Executed secondary-analysis workflow. Source A is a historical Bangladesh evaluation; Source B has unverified student geography. The prospective Bangladesh pathway is not implemented. Inputs follow Biswas et al. (2019) and (Shohag & Bakaul, 2021)
3.4 Evaluation metrics and conditional uncertainty
The measures used were: dropout recall, dropout precision, dropout F1, balanced accuracy, overall accuracy, and number of alerts. If the orientation is as above, then the recall is TP/(TP+FN), and precision is TP/(TP+FP), and the dropout F1 is 2TP/(2TP+FP+FN). Balanced accuracy is (TP/(TP+FN) + (TN/(TN+FP))/2. Alert count: TP+FP. The majority-class F1 was also computed for the orientation comparison. Correlation coefficient (Macro-F1 and Matthews) are provided in the machine-readable supplement only and are not considered as secondary endpoints.
Two reference rules were calculated, one transparent (no alerts) and one transparent (alert everyone). These are not fitted algorithms. The no-alert rule tells us the best accuracy parameter that can be achieved by selecting the majority label only; the all-alert rule sets the cost parameter of capturing all labels in the simplified loss model. For a rule that does not generate alerts, undefined precision is not present, not zero. This maintains the differences between unavailable ratio and measured value.
Binomial denominators and z=1.959964 were used to calculate Wilson 95% intervals for recall and precision. The intervals are based upon uncertainty, given the reported evaluations and a binomial working model. They do not control for model selection optimism, training variability, clustering and nonrepresentative sampling frame. No significance test or confidence interval for differences between models can be recovered, nor are there any joint models predictions at the learner level. Non-overlap and overlap of the intervals displayed is not used as a formal paired comparison.
3.5 Decision-analytic sensitivity assessment
Three analyses explore the impact of operational assumptions on interpretation. First, a loss score is used L=FP+λFN, where λ is an assumed cost of a missed labelled case compared with a false alert. The grid numbers are in increments of 0.25 from 0 to 20. Losses are compared within the two reference rules and within each source, the minimum loss attained at each λ forms a descriptive lower envelope. The metric has no units of Bangladeshi taka and it doesn't appreciate a student's education. It's a sensitivity device, not a comprehensive economic assessment, as it excludes review costs, effectiveness of interventions, and differential severity.
Second, the three rules of tied accuracy in source A are compared across one to twelve possible number of reviews. The published outputs do not contain individual risk scores, but rather an unranked alert list. When the number of slots is less than the number of alerts, it is assumed to be uniform random selection from a fixed list. The number of labeled cases to be reviewed is expected to be TP×min(K,A)/A where K is capacity and A=TP+FP. This calculation was not an estimation of prevented dropouts nor a simulation of students. It separates out the effect of alert volume with an explicit rationing hypothesis that would have to be evaluated by a real system's triage procedure.
Third, an assumed value of the event fraction π is varied from 5% to 40% on a grid while holding the observed values of Se and Sp fixed. If this is true, then positive predictive value is equal to πSe/[πSe+(1−π)(1−Sp)]. The denominator provides the expected alert rate, the numerator provides the expected missed fraction π(1−Se). These are just hypothetical transport calculations and not the estimate for any Bangladeshi University. The invariance of Se and Sp is unverifiable because it could be contradicted by a shift in teaching, population and/or data collection.
3.6 Reproducibility and identifiability boundaries
The supplementary package includes source-coded input tables, reconstructed matrices, all derived metrics, discrepancy audit, scenario grids, a reference ledger and a runnable Python script. The integrity of integer sums, class supports, candidate uniqueness, rate bounds and file checksums were also verified programmatically. The inputs to the calculations are fixed and the formulas are deterministic – only randomness is used in the conceptual interpretation of the uniform rationing and an exact expectation is used, not a simulation. These outputs are stored and figures are generated from them but there is no feedback from the rounded chart label to the calculations.
Confusion matrices can only be used to identify threshold-specific counts and not a full risk distribution. Therefore, no ROC curves, area under a precision–recall curve, Brier scores, calibration intercepts and slopes, SHAP values, subgroup error gaps or a measured warning lead time are reported. These would need predictions or records that are not available. Calibration and leakage are mentioned as properties to be validated in the future but are not explicitly reported to have been successfully tested in this study (Guo et al., 2017; Kapoor & Narayanan, 2023; Van Calster et al., 2019). The proposed operational framework is presented following the empirical results to avoid the misconception that the steps taken in model development have been executed.
4. Results
4.1 A small minority denominator changes the interpretation of performance
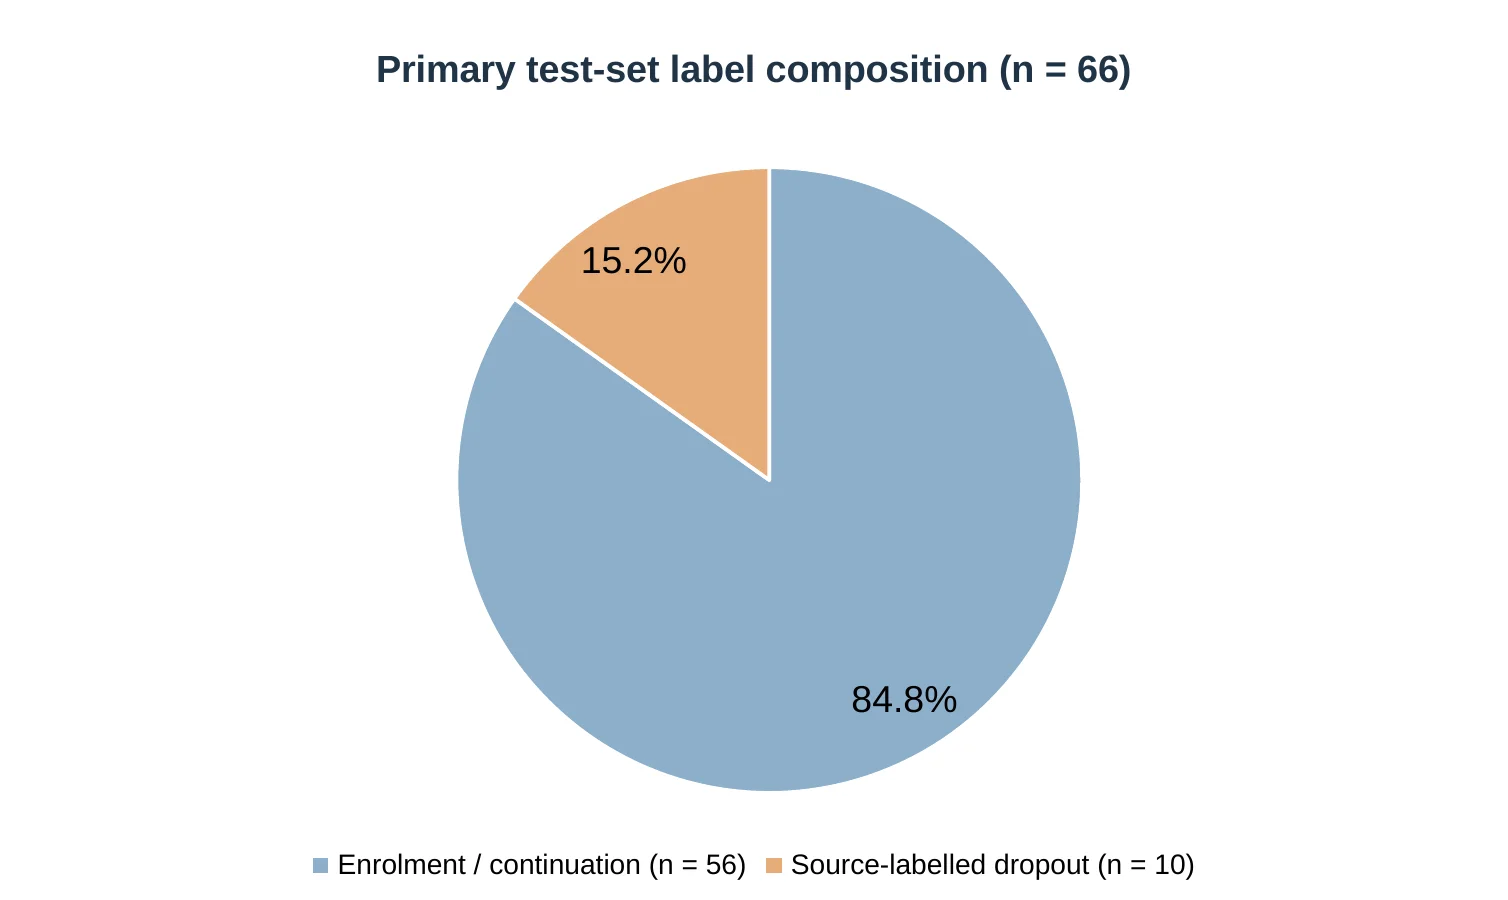
The integer reconstruction yielded 56 source-labelled enrolments and ten source-labelled dropouts in each Source A matrix. The labelled event fraction was therefore 15.15% of the 66-record test set. This is a property of a historical departmental evaluation, not a Bangladesh dropout rate. Figure 2 presents the denominator because the practical meaning of each subsequent performance score depends on it.
Figure 2.Label composition of the primary test set. The counts were reconstructed from (Biswas ,2019), Table 2, which includes 56 enrolment labels and 10 dropout/noncompletion labels. Percentages refer to these 66 records, not to the national or institutional rate of dropouts.
For each case found, dropout recall increases by 10 percentage points. A rule that does not alert makes a correct classification for all 56 majority class records, resulting in 84.85% accuracy. The three models with the highest accuracy are all above that baseline with 57 accuracy records. In fact, the accuracy of the two is the same (86.36%, which is quite high), so not much can be inferred from the two scores. The reconstruction does not assume any unreported training outcomes and sets up the arithmetic directly.
The full evaluation with the primary cases dropped out is shown in Table 2. The number of false alerts for PART, locally weighted learning and Naive Bayes are 5, 0 and 1 respectively. The other classifiers are not just a simple ordering by complexity, but are showing different compromises. The neural and random-tree models are also able to detect 4 cases, but produce more false alerts than PART, and the random forest detects 2 cases and produces 8 false alerts.
Table 2. Primary-case confusion counts and dropout-oriented performance (n=66).
Classifier
TP / FN / FP / TN
Accuracy (%)
Recall (%)
Precision (%)
F1 (%)
Alerts (n)
Naive Bayes
2 / 8 / 1 / 55
86.36
20.00
66.67
30.77
3
Multilayer perceptron
4 / 6 / 7 / 49
80.30
40.00
36.36
38.10
11
Logistic regression
1 / 9 / 1 / 55
84.85
10.00
50.00
16.67
2
Locally weighted learning
1 / 9 / 0 / 56
86.36
10.00
100.00
18.18
1
Random forest
2 / 8 / 8 / 48
75.76
20.00
20.00
20.00
10
Random tree
4 / 6 / 11 / 45
74.24
40.00
26.67
32.00
15
PART
6 / 4 / 5 / 51
86.36
60.00
54.55
57.14
11
Note. Positive class = source-labelled dropout. TP = detected case; FN = missed case; FP = false alert; TN = correctly unflagged non-dropout. Counts are uniquely reconstructed; intervals and balanced accuracy are supplied separately.
4.2 Reorienting F1 reverses the apparent preference
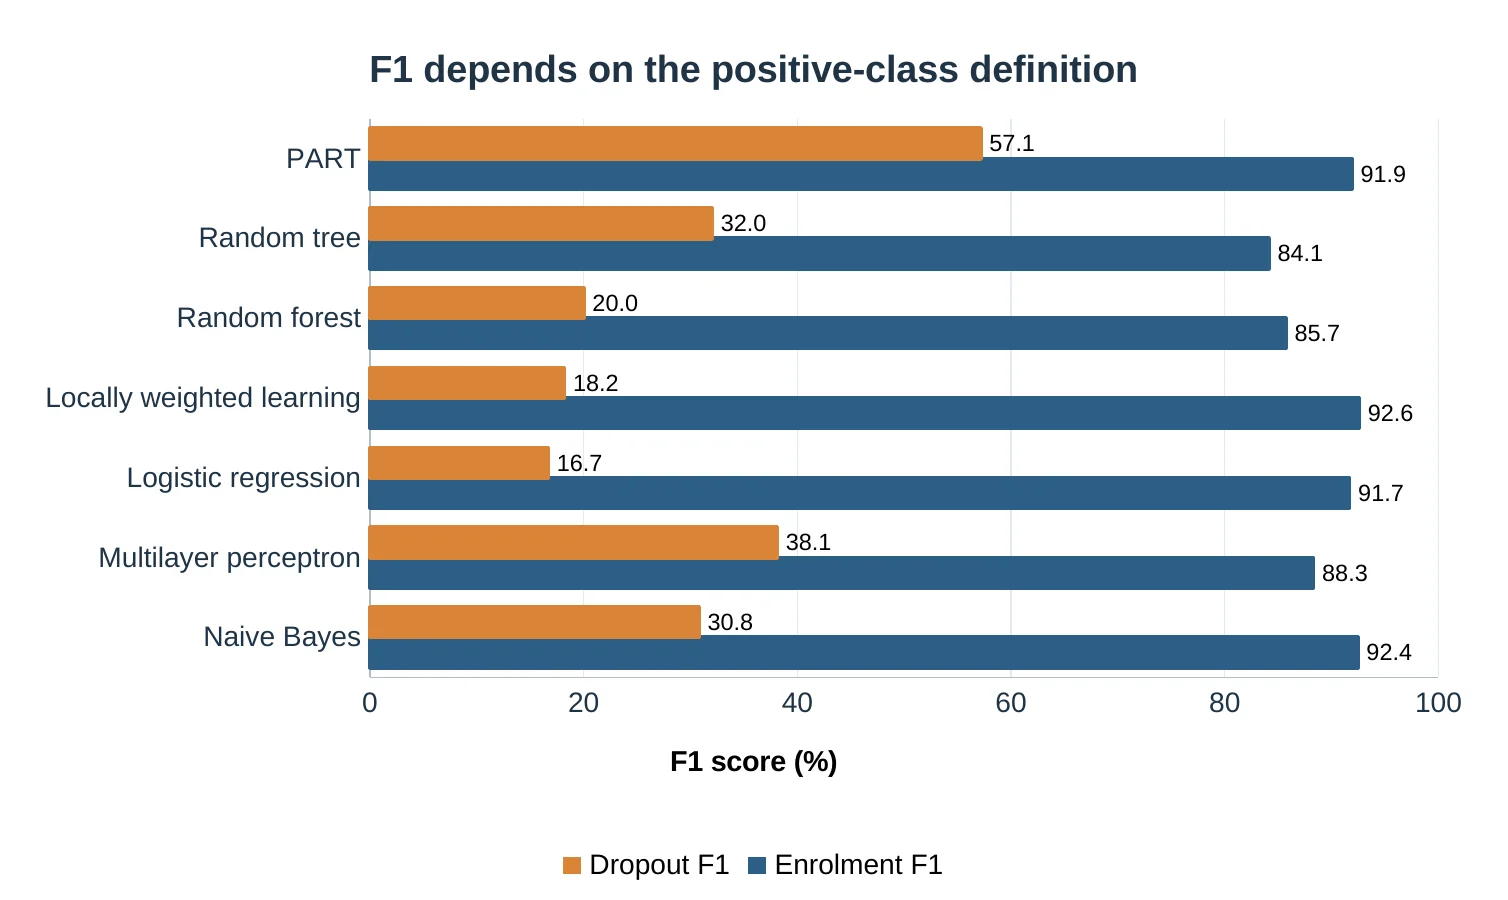
The original enrolment-oriented F1 comparison places locally weighted learning marginally ahead of Naive Bayes and PART. Recalculation gives majority-class F1 values of 92.56%, 92.44%, and 91.89%, respectively. When dropout becomes the positive class, the corresponding values are 18.18%, 30.77%, and 57.14%. Figure 3 shows the contrast for all seven classifiers. The result is a change in evaluation target, not a new fit or an improvement to the underlying models.
Figure 3.Two series under opposite positive class orientations: F1, Source A. Both series computed from the same model-specific integer counts. Enrolment F1 is an evaluation of the majority class, while dropout F1 is an evaluation of the warning target. Bars represent descriptive comparisons—not independent trials.
Even though both F1 and locally weighted learning models are equally accurate, in this test set, PART's dropout-oriented F1 is more than three times higher. They are also distinguished by their balanced accuracy scores: 75.54% for PART, 59.11% for Naive Bayes and 55.00% for locally weighted learning. These summaries provide more visibility of minority detection, but do not prescribe an advising policy. Policy implications depend on the ability of an institution to be able to review the alerts and what sorts of error count in its support pathway.
The difference in published F1 percentages and the F1 percentages calculated from the matrix are less than 0.01 percentage points. These subtle differences in displays do not account for the substantive ranking switch. The reversal is due to the high F1 of the successful identification of enrolment at the source compared to this paper's warning objective – the source-labelled drop-out group. It is a reporting decision, not a cosmetic one, to name the positive class.
4.3 Missed cases, alert burden, and uncertainty remain substantial
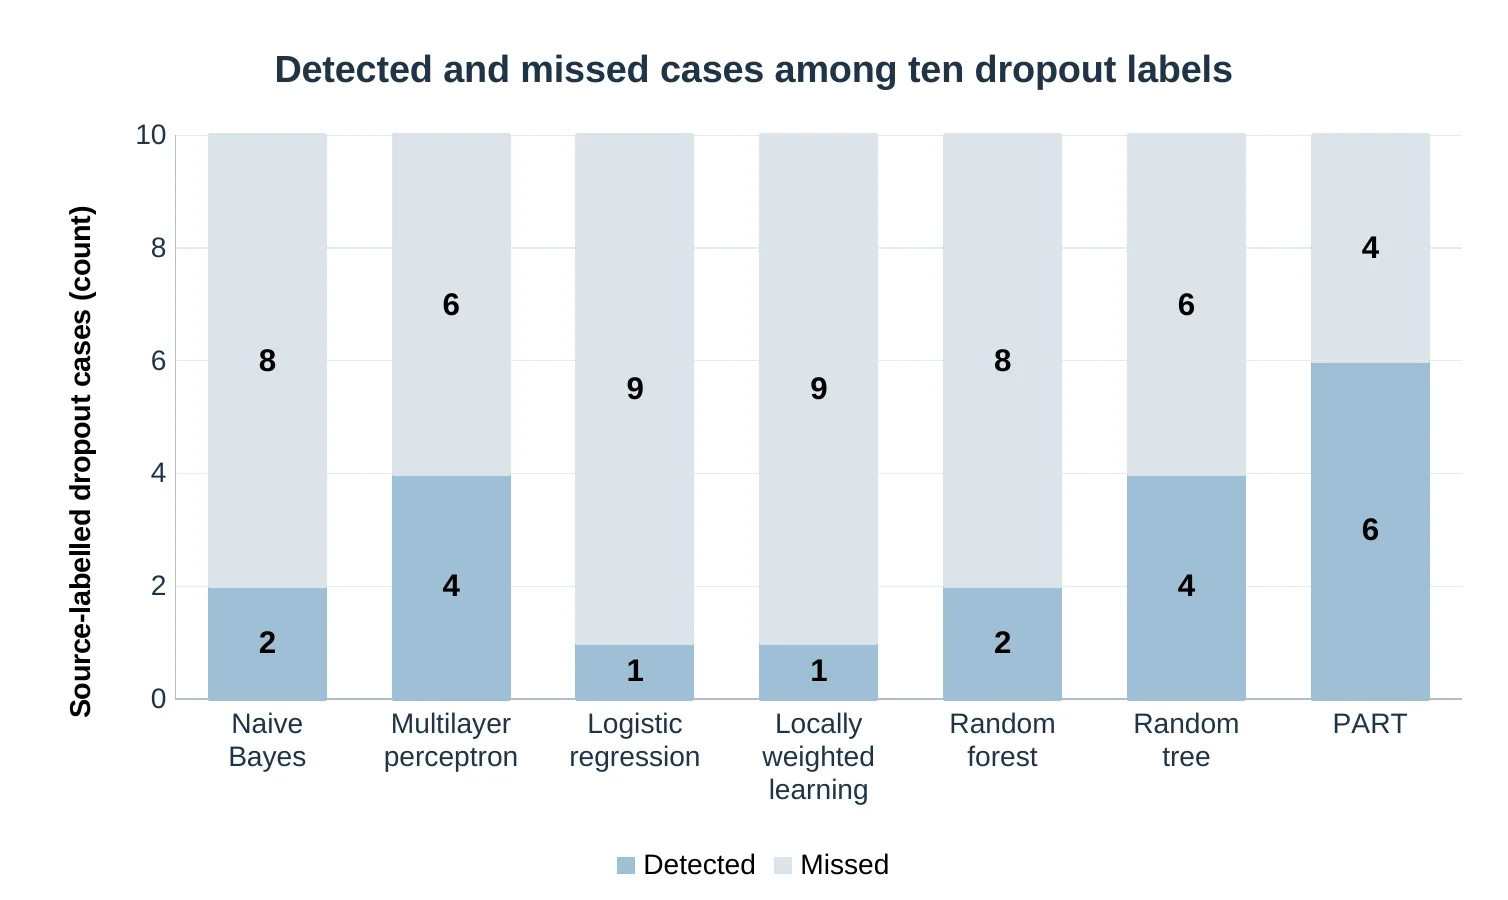
The ten cases with labels, indicating dropouts and missed cases are shown in figure 4. Nine of them are missed by locally weighted learning, eight are missed by naive bayes and four are missed by PART. Naive Bayes and locally weighted learning only detect three and one cases respectively, whereas PART detects more than one case for each of its six detected cases (16.67%). This is not a trade-off between accurate and inaccurate models, but a trade-off between breadth and number of records to review.
Figure 4.Detected and missed source-labelled dropouts, Source A. Every bar has denominator ten, with records recurring across classifiers. Counts do not establish statistically significant differences. Conditional recall intervals are discussed in the text and supplied with the data.
The apparent 100% precision of locally weighted learning comes from a single correct warning. Its 95% Wilson interval is 20.65–100%, making the point estimate a weak basis for a high-confidence service claim. PART’s precision is 54.55% with an interval of 28.01–78.73%; its recall of 60% has an interval of 31.27–83.18%. Naive Bayes recall is 20%, with an interval of 5.67–50.98%, while the locally weighted recall interval is 1.79–40.42%. These wide ranges reflect small conditional denominators and are not evidence that the models are equivalent.
No matrix identifies whether the same individual is detected by two different classifiers. An ensemble formed from the union of alerts could therefore have different behaviour depending on overlap that is not recorded in the tables. It would be unjustified to add detected counts across models, estimate a combined recall, or assert that switching models necessarily reaches a specific additional student. The defensible result is the set of model-specific counts, not a reconstruction of their joint predictions.
4.4 Preference changes with error valuation and review capacity
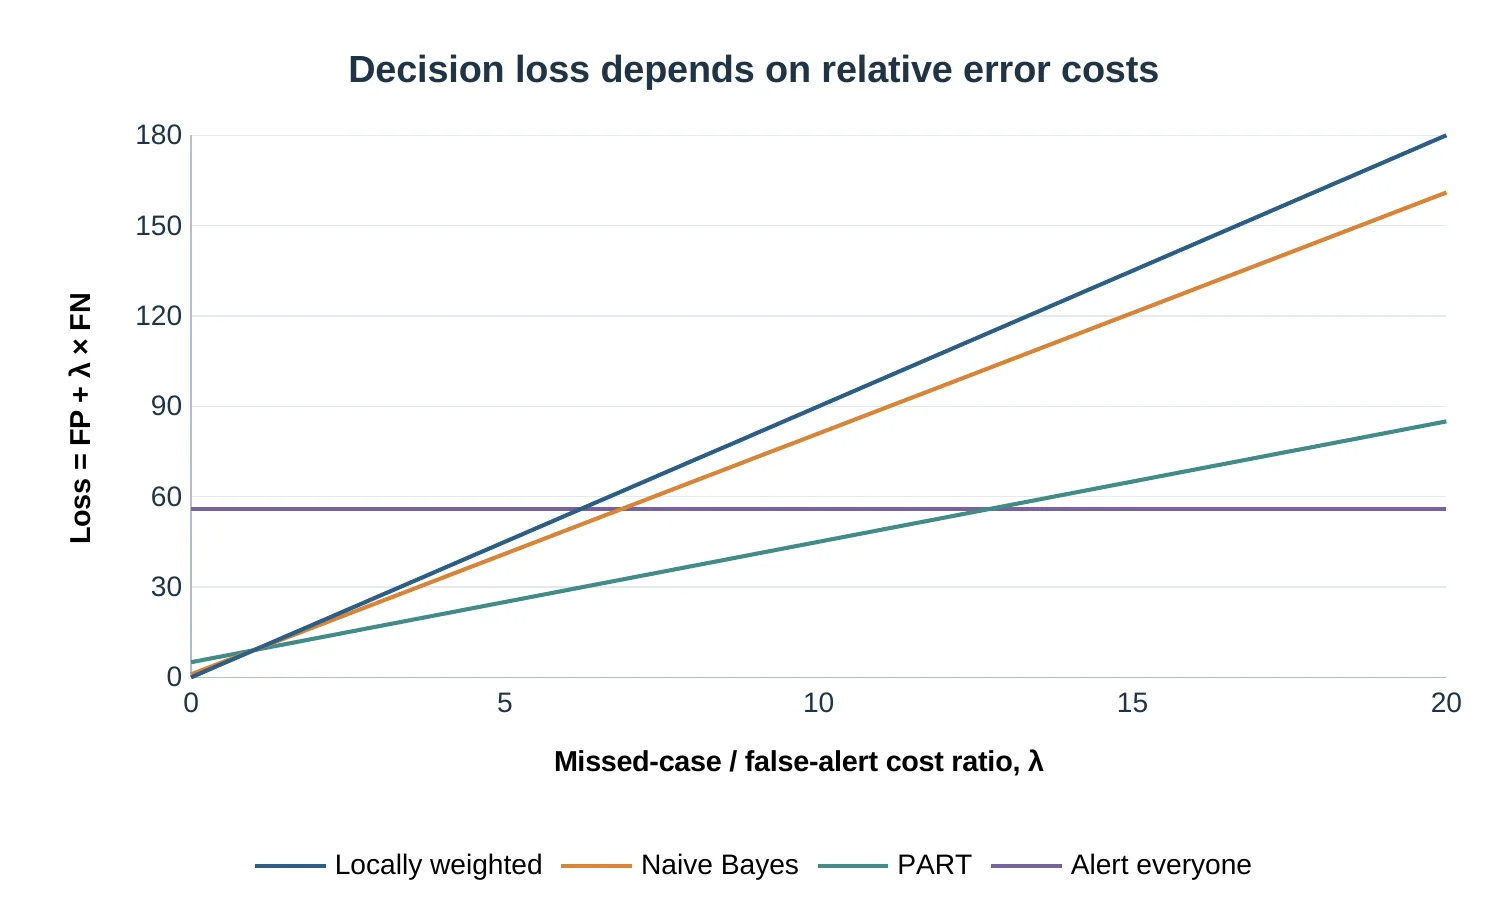
For The loss functions for the three tied-accuracy rules are simplified: 9λ for the locally-weighted learning, 1+8λ for the NaiveBayes, and 5+4λ for the PART. All three make nine classification errors and it is concluded that all three have lost nine at λ=1. The locally weighted learning approach is employed when 0<λ<1 and when 1< λ<12.75, the performance of the PART is the poorest among the tested ones. For λ=12.75, PART is tied with the all-alert rule, and for λ>12.75, it is preferable to alert all individuals under this decreased objective. Figure 5 provides a comparison of the frontier that is relevant.
Figure 5.Relative error-cost sensitivity for three tied-accuracy classifiers and all-alert reference rule. It is desirable to have as low a loss as possible in the expression L=FP+λFN. Lower envelope has a change at λ=1 and λ=12.75. The values entered for scenarios are hypothetical in nature and actual review and benefits of intervention are not included.
The accuracy tie explains why missed cases and false alerts have different consequences in the case of λ=1. A second drawback of the all-alert crossover is that if miss cases are given high relative costs, a model is useless when the goal is not to consider the cost of reviewing true alarms. This is not a guideline for flagging students, rather it is a property of the stated loss function. Institutions would have to determine a more comprehensive utility model in order to choose a true operating rule.
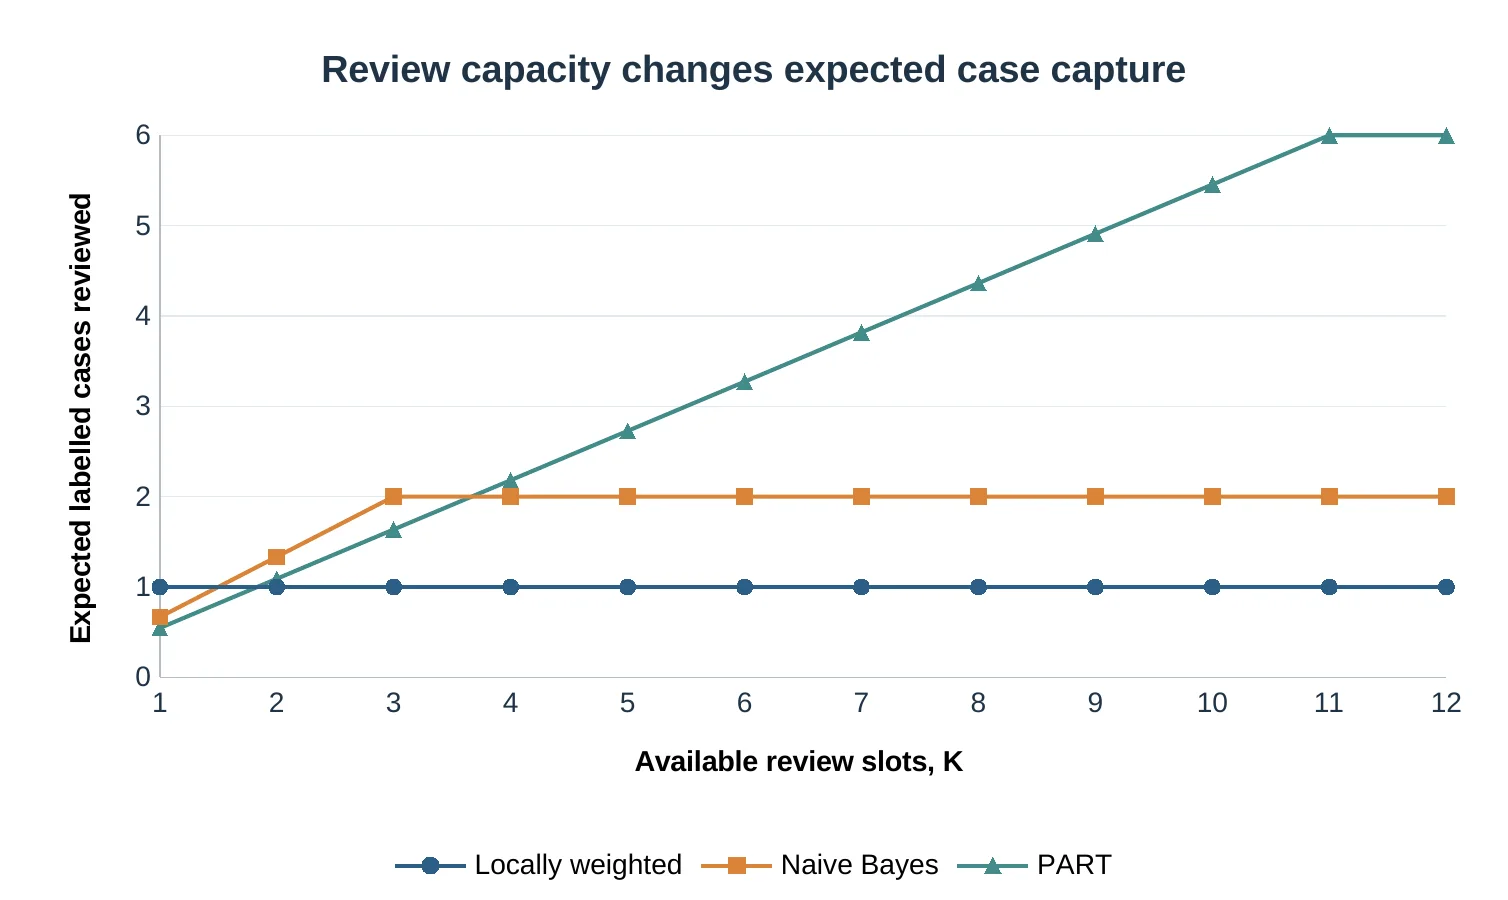
When users look at the review capacity, they will create another preference pattern. In these fixed alert lists, the locally weighted learning saturates after the first case that it was seen, while the Naive Bayes saturates after the second case that it was seen, and after the third case that it was seen, respectively. After eleven slots, PART is at 6. With 3 slots it has a mean of 18/11 cases or less than 2 cases, with 4 it is 24/11 cases or less than 2 cases, which is less than Naive Bayes with 4 slots. This artificial situation thus yields four slots at which the intersections of the integer capacities take place (Figure 6).
Figure 6.Capacity sensitivity among the three tied-accuracy classifiers. Curves are exact expected counts under uniform selection when slots are fewer than alerts. They are not measured precision-at-K curves, contact rates, or prevented dropouts. Unused capacity cannot identify further cases from a fixed list.
The capacity result doesn't measure actual student engagement, receipt of support, or retention following intervention. It demonstrates that the fixed predictions of the source can lead to a different yield from the reviews under different conditions of lower availability of slots. The ordering may be different because of risk ranked scheduling, variations in case complexity, non-response, or prioritisation based on the need for immediate treatment. Those mechanisms, of course, cannot be evaluated without learner-level scores, and the curves should not be called a measured precision at K experiment.
4.5 Apparent precision is sensitive to the assumed event fraction
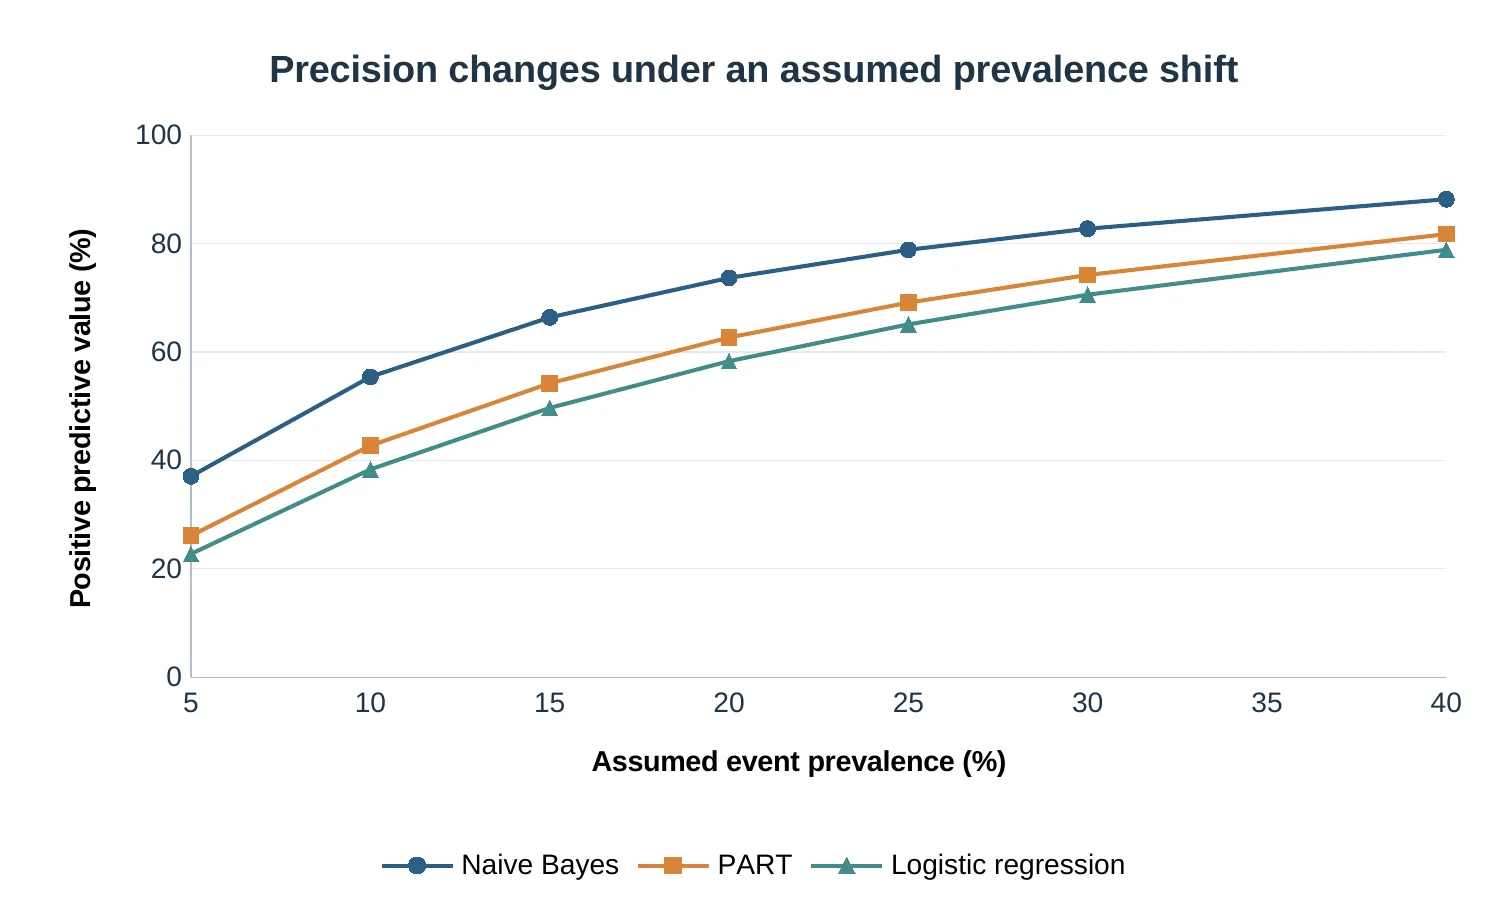
For PART, the prevalence scenario changes positive predictive value from 26.13% at an assumed 5% event fraction to 81.75% at 40%. For Naive Bayes, the corresponding values are 37.09% and 88.19%. These values follow from the fixed sensitivity and specificity of the primary test matrices, not from additional students. Figure 7 shows the scenario profiles alongside logistic regression as a low-recall comparison. Higher assumed prevalence increases the proportion of warnings that correspond to a labelled event, conditional on the invariance assumption.
Figure 7.Prevalence sensitivity, or positive predictive value (PPV): This is a term that refers to the relationship between a higher event fraction and a higher prevalence sensitivity. These scenarios are not observed populations or recalibration results. The zero false positive locally weighted rule is included in full outputs.
Because of the mechanical nature of the zero false positives, the precision for the zero observed false positives in the locally weighted model is always 1 across the prevalence grid and is therefore not plotted. That line is especially susceptible to overinterpretation due to the single true alert and the wide precision interval. Its full scenario output is still included in the supplement however. That this result is not part of the main visual is not due to a change in the analytical sample but, rather, due to a presentation decision and suppression of an unfavourable result.
4.6 Supplementary audit: consistency matters before comparison
The Source B matrices are the same common denominator (474) as the dropouts (85) and non-dropouts (389) matrices. The highest calculated accuracy is for random forest (86.29%) which identified 37 of the 85 labelled cases (43.53% recall). Decision tree has 48.24% detection rate and 53 false alerts at 79.54% accuracy. K-nearest neighbours achieves 84.60% accuracy and 25.88% recall and the support vector machine achieves 83.97% accuracy and 21.18% recall. The baseline for no alerts is 82.07%. These comparisons are made separately in Table 3 and are not included in Source A.
Table 3. Separate supplementary evaluation with unverified student geography (n=474).
Classifier
TP / FN / FP / TN
Accuracy (%)
Recall (%)
Precision (%)
F1 (%)
Alerts (n)
Decision tree
41 / 44 / 53 / 336
79.54
48.24
43.62
45.81
94
Naive Bayes
37 / 48 / 88 / 301
71.31
43.53
29.60
35.24
125
Support vector machine
18 / 67 / 9 / 380
83.97
21.18
66.67
32.14
27
K-nearest neighbors
22 / 63 / 10 / 379
84.60
25.88
68.75
37.61
32
Random forest
37 / 48 / 17 / 372
86.29
43.53
68.52
53.24
54
Note. Positive class = source-labelled dropout. TP = detected case; FN = missed case; FP = false alert; TN = correctly unflagged non-dropout. Counts are transcribed and reoriented. Conflicting published percentages remain in the discrepancy ledger.
The accuracy of the published counts is 71.31%, compared to the 71% table entry in the source, and 80% table entry in the source. Later class report precision and recall are 66% and 45% while random forest dropout precision and recall are 68.52% and 43.53% respectively. A discrepancy ledger is maintained to keep track of both versions. The comparative lesson is that the reported numbers of a class should align with their own before the use of the class specific report for model selection, which doesn't make clear the cause of the reporting error.
After full case selection 53.23% of the initially merged Source B records remain. The prevalence or performance may be affected by the exclusion of these records, and the effect of excluding them is not quantifiable because the outcome distribution for these records was not analysed. This case does not prove any algorithm to be better than the other one in Bangladesh. It provides examples of the extra source tracking and reporting that must be done before an apparently larger evaluation can support an early warning attribution.
5. Discussion
5.1 The central result is an evaluation mismatch, not an algorithmic breakthrough
The main analysis reveals that the overall correctness of a city can mask substantially different rates of sourcelabelled minority group capture. A positive enrolment F1 is its best value, in the sense that it does not provide an answer to the question that a dropout-warning service asks. Reorienting the same counts changes a near-tie among three reported leaders to a significant difference in minority F1 and recall. This aligns with the general concern of binary evaluation under imbalance (Chicco & Jurman, 2020), and provides an auditible Bangladesh example for the concern, instead of a generic one.
The findings are in opposition to a new higher education leaderboard in Bangladesh. No independent institution or training-replication experiment has been completed; but several dropout-oriented summaries have been completed in one small historical test set, in which case PART is preferable. It is important to remember that the contrasting random-forest results from the two sources highlight the importance of not relying on an algorithm name as a performance guarantee. (Agrusti et al., 2019) and (Romero & Ventura, 2020) provide a review of dropout prediction and educational data mining, which includes a heterogeneous group of populations, features and targets. Do not blindly copy this advantage over another study that employed the same family of classifiers for the apparent benefit of the model; it is important to understand the advantages of the model in that context.
The supervised-learning applications are also found relevant in the above cited literature window as confirmed by the 2024 university dropout study in Bangladesh (Akter et al., 2024). A higher publication year and/or summary score doesn't solve endpoint validity, minority error, and/or lead time if the properties are not reported. The following cases of numbers are not intended to be exhaustive of recent work in Bangladesh. They are intended to show an evaluation problem that is reproducible and to determine what other documentation would be needed for a better synthesis.
5.2 Calibration, capture, and service effectiveness are different claims
Three different questions should be kept as separate questions. Classification: Question: Does a thresholded prediction agree with a label? Calibration is the question of whether the predicted probabilities are equal to the observed frequencies. Intervention Evaluation: Does taking an action on the warning lead to improved results that are meaningful to students? The present evidence focuses on the first, and implications for the allocation of review are explored using scenarios. It doesn't give a solution for the second or third. Calibration literature provides reasons for evaluating numerical probability claims at the level of probability (Guo et al., 2017) and reviews of learning analytics warn that the predictive power does not imply a demonstrated support of study success (Ifenthaler & Yau, 2020)
These cost and capacity results demonstrate this separation. A change in λ does not re-calibrate a classifier but rather changes the goal to compare fixed outputs. Rationing alerts is not a description of optimally treated patients but merely indicates the selection of patients who may be included in the review according to a surmise about the selection rule. These differences makes it impossible to analyze escalate: a simple classification problem is touted as a realised decision system. They also provide institutions with helpful options: gather more probabilities, rework the support pathway, or boost the endpoint before implementing a more complicated model.
Service waste is not necessarily synonymous with model error. Even if a student is not classified as a dropout, they may require financial assistance, access support or academic counseling. On the other hand, if the withdrawal is identified later it does not necessarily imply that the withdrawal is undesirable or preventable. Attention to missing circumstances and student accounts are supported by research explaining errors in predictive-learning-analytics (PLA) (Hlosta et al., 2022). A practical system should, therefore, consider suitable offers of support and their implications as well as statistical discrimination. The confusion matrix is not enough to measure the educational value because it is needed for accountability.
5.3 Bangladesh relevance lies in design requirements, not imported prevalence
The local contribution is an account of a historical departmental prediction case, as well as information on the understanding of digital participation. The access barriers can influence the things observed by the institutions, as evidenced by the studies conducted in Bangladesh on online learning and the digital divide (Dey, 2023; Islam & Habib, 2022; Priyo & Hazra, 2021). This helps to fulfill a concrete design need: “when there is no learning, there must be no platform activity” (if there are records) and “when there is no uncertainty, there must be no learning” (when there are no records). It does not excuse the use of a causal dropout coefficient for connectivity or use the present test-set event fraction throughout the country.
The model developed in one department of a public university cannot be assumed to apply to other departments, private universities, affiliated colleges, or distance learners or other disciplines. These situations can be different in terms of enrollment processes, availability, and what constitutes an interruption. These are suggested transport questions, not seen as a contrast in this analysis. An author's institutional address is not a substitute for a data provenance statement (as Source B illustrates), even for simple geographic attribution. When talking about the generalisation of a predictor, there have to be some clarity about who these records belong to, given that it is a Bangladesh facing evidence-base.
Previous institutional implementation research shows that the educators' role and the organisational processes are pivotal to analytics adoption (Herodotou et al., 2019, 2020).Hence, the proposed framework puts responsibility on model developers, as well as on registrars, advisers, teaching teams and students. The warning needs to be clear about where it came from and what it needs to do to correct the situation. It must never be used alone to limit access to learning opportunities, registration or funding for a student or be used to describe a student as a fixed characteristic. These are normative safeguards based on the limited evidence and ethics in learning analytics research (Rets et al., 2023).
6. Proposed early-warning validation and support pathway for Bangladesh
The following pathway is a potential contribution, not performed in the current secondary study. The first is an agreement on the outcome dictionary. There is a need to distinguish between validated withdrawal, temporary interruption of studies, transfer, completion of a programme and unresolved status of registration. A binary target can only be obtained if it is determined which states are considered to be the event and what is done with the uncertain cases. All participants in the cohort should be students who are actually entitled to the experience at the prediction landmark. For instance, if the target of re-registering for the next semester is implemented, the programme length would cause a learner's programme to be excluded from the re-registered programme, and leave transfer as a separate status in a verified programme.
Secondly, the institution must set the index times and data availability prior to model fitting. The information needed for admission, the initial assessment and later engagement summaries should be segregated from an undifferentiated “early” feature set to support various warning opportunities. Both the time of the event and the time that the institution had the opportunity to receive the value should be recorded in a record. The Open University data set is a valuable example of linked, time-aware education records, whereas in the Portuguese dropout data set, different results are obtained for the continuous and final outcomes (Kuzilek et al., 2017; Realinho et al., 2022).These precedents inform structure, but do not provide external validation for Bangladesh.
Third, an initial study of model development should involve comparing a clear, regularised logistic baseline with a small set of tree-based alternatives that are well motivated. Imputation, encoding, feature selection and any resampling would be learned during training folds. A locked temporal test should be conducted on repeated student records, with earlier cohorts assisting with model development and later cohorts on the test. If there is more than one institution involved, at least one should be independent of training and calibration. Every predictor should have been present at the landmark and leakage checks should be documented for this reason (Kapoor & Narayanan, 2023). These are recommended procedures, and not analyses that are imposed on the two source studies after the fact.
Fourth, having completed the process of probability validation, a service threshold should be established. The institution would analyze calibration plots, Brier scores and intercepts and slopes of the plots in addition to dropout recall, precision, balanced accuracy, and alert volume. If justified, recalibration would be based on a held-out calibration set, not the actual test labels. Numbers of thresholds would be selected based on the actual budget for reviewing the review and locally agreed estimate of unmet support and unnecessary contact. The maximum accuracy obtained from a test set or hypothetical λ values presented in this paper will not be considered a proper criterion for selecting thresholds. While data balancing can help with learning, it is not a substitute for evaluating probabilities at the prevalence of the target population (Mduma, 2023)
Fifth, with regard to errors, and access to service, it would be helpful to do a subgroup assessment. Dimensions could be gender, economic circumstances, disability (if appropriately and legally recorded) and reported connectivity constraints. Inclusion would need to be based on an explicit ethical and data-governance framework, sufficient uncertainty reporting and a clear purpose – sensitive information should not be obtained because it could improve a score. Fairness assessment should include consideration of who is being left out, who is getting too much contact and who could benefit from the offered support. Removing one sensitive predictor does not ensure equity of outcomes (Baker & Hawn, 2022; Suresh & Guttag, 2021) because of the presence of educational bias and life-cycle harm frameworks.
Finally, a validation phase (silent) should be differentiated from an intervention phase in a prospective investigation. In silent evaluation predictions would not impact normal support and could be verified with the subsequent outcomes observed under an agreed governance model. A further intervention study would record contact attempts, successful contact, student consent to support, provision of support, uptake and outcomes. A randomised or appropriately designed phased evaluation might then be able to provide an estimate of the impact of the support pathway rather than just the relationship between warning and withdrawal. The focus on teachers and on explicit education reasoning stems from fears reported in the field of higher-education AI research (Zawacki-Richter et al., 2019).The proposed decision is not a classification/sanction decision, it is a “review and offer support” decision. A staff member should have the ability to review the cause of a warning, correct incorrect information, document a student's explanation, and close or redirect a case, without relying on the algorithm as an authoritative source of information. Communication should be done in an accessible language and provide alternative means for students who do not routinely use the digital platform. The institution should keep track of the time taken to respond to the violations, time taken to resolve the violations and time taken to detect the violations. The capacity sensitivity result becomes a practical question when an alert is issued: what will happen when the alert is issued, and will the institution have the resources to do it well?
7. Limitations and future research
The greatest limitation is the limited evidence base. Ten source-labelled dropout outcomes are provided in a test set of 66 records for the primary quantitative case from a single historical departmental context. It does not have a definite, future withdrawal point on its labels. The supplementary case has less numerators than the primary case but verified student geography and incomplete selection and evaluation details are reported. These restrictions leave national estimates, algorithm-level generalisation and statements about the results describing the current situation in Bangladeshi HE out of scope. The numerical contribution is a reconstruction and interpretation audit and it should not replace locally governed student level research.
Other ways of reducing identifiability are aggregate tables. They do not provide information on probability distributions, individual alert overlap, uptake of interventions, subgroup membership or timing of predictors and outcomes. The Wilson intervals are based on the reported counts and exclude all sources of uncertainty. The consistency checks are not able to determine if the discrepancies are in the transcription of the code, order of the classes, or reporting. Another limitation of the extracted content is that it is based on a parsed PDF text, and not on successful page-image inspection; the provided source locations and raw values allow for independent author checking before submission.
The decision scenarios are based on assumptions which have not been raised in a Bangladesh institution. Error-cost ratios do not measure valuations of errors, capacity calculations are based on uniform selection from fixed lists and prevalence calculations are based on stable sensitivity and specificity. They are useful because the results of their use are clear, which is not because the values chosen are operating conditions. There are no estimates of the number of students not supported on the graph. Future research should seek to gather actual review time, response rate, case complexity and intervention outcomes before making a full resource-allocation or cost-effectiveness analysis.
The literature synthesis is not comprehensive, but only covers publications from 2017-2024. Note that the area covered by this historical boundary does not reflect any later development, and should not be used as a present-day inventory of the field. The next empirical step is a multi-institutional, time-stamped cohort in Bangladesh that has independently adjudicated outcomes and a locked evaluation plan. One of these studies might investigate whether the use of stronger feature provenance, probability calibration and capacity-aware thresholds will increase the number of useful cases identified. It is only through a subsequent intervention design that it can be determined whether the support system will help students, including those who would like to keep going with their enrollment but who would like to experience an interruption or transfer supported by the system.
8. Conclusion
If an early warning system has a high summary classification score, this does not justify a supervised-learning system. Three of the models in the audited Bangladesh case has 86.36% accuracy and recognize one, two, and six of ten source-labelled dropouts. When evaluation is re-oriented towards the warning target, this difference becomes apparent and considerable uncertainty is uncovered with respect to the apparent precision. The next fixed rule seems to be preferable with explicit cost and review-capacity assumptions. These are results of published aggregate evidence and not a new predictor or reduction in dropout. The contribution is a replicable journey from source verification to minority outcome evaluation and bounded decision analysis. The sensible following step for Bangladesh is a pupil-centred validation pathway, which is time-aware, has verified outcomes, calibrated probabilities, sufficient review capacity and independently evaluated support.
Data availability statement
The numbers entered are cumulative data taken from the referenced published tables. This manuscript is accompanied by source coded CSV files, reconstructed confusion matrices, derived results, scenario grids, and analysis code. No original student-level data or prediction probabilities were gathered or calculated. The studies are original and the source publications are the source of the studies. The authors should include an archival repository identifier, as required by the target journal, for this study's reproducibility package prior to submission.
intervention.
Author declarations
Author identities, affiliations, CRediT contributions, funding, competing interests, and any journal-required disclosure of AI-assisted preparation must be supplied and approved by the submitting authors. No funder, approval, author contribution, or absence of competing interests has been assumed in this manuscript.
References
Agrusti, F., Bonavolontà, G., & Mezzini, M. (2019). University dropout prediction through educational data mining techniques: A systematic review. Journal of e-Learning and Knowledge Society, 15(3), 161–182. https://doi.org/10.20368/1971-8829/1135017
Akter, T., Ayman, U., Chakraborty, N. R., Islam, D. A., Mazumder, A., & Bijoy, M. H. I. (2024). Dropout prediction of university students in Bangladesh using machine learning. In 2024 IEEE International Conference on Computing, Applications and Systems (COMPAS) (pp. 1–7). IEEE. https://doi.org/10.1109/COMPAS60761.2024.10797033
Baker, R. S., & Hawn, A. (2022). Algorithmic bias in education. International Journal of Artificial Intelligence in Education, 32, 1052–1092. https://doi.org/10.1007/s40593-021-00285-9
Biswas, A. A., Majumder, A., Mia, M. J., Nowrin, I., & Ritu, N. A. (2019). Predicting the enrollment and dropout of students in the post-graduation degree using machine learning classifier. International Journal of Innovative Technology and Exploring Engineering, 8(11), 3083–3088. https://doi.org/10.35940/ijitee.K2435.0981119
Chicco, D., & Jurman, G. (2020). The advantages of the Matthews correlation coefficient (MCC) over F1 score and accuracy in binary classification evaluation. BMC Genomics, 21, Article 6. https://doi.org/10.1186/s12864-019-6413-7
Dey, P. R. (2023). Factors responsible for the existence of digital divide in higher education and its impact on academic performance during COVID-19. BAUET Journal, 4(1), 201–207. https://doi.org/10.59321/BAUETJ.V4I1.29
Guo, C., Pleiss, G., Sun, Y., & Weinberger, K. Q. (2017). On calibration of modern neural networks. In Proceedings of the 34th International Conference on Machine Learning (Vol. 70, pp. 1321–1330). PMLR. https://proceedings.mlr.press/v70/guo17a.html
Herodotou, C., Rienties, B., Verdin, B., & Boroowa, A. (2019). Predictive learning analytics “at scale”: Guidelines to successful implementation in higher education. Journal of Learning Analytics, 6(1), 85–95. https://doi.org/10.18608/jla.2019.61.5
Herodotou, C., Rienties, B., Hlosta, M., Boroowa, A., Mangafa, C., & Zdrahal, Z. (2020). The scalable implementation of predictive learning analytics at a distance learning university: Insights from a longitudinal case study. The Internet and Higher Education, 45, Article 100725. https://doi.org/10.1016/j.iheduc.2020.100725
Hlosta, M., Herodotou, C., Papathoma, T., Gillespie, A., & Bergamin, P. (2022). Predictive learning analytics in online education: A deeper understanding through explaining algorithmic errors. Computers and Education: Artificial Intelligence, 3, Article 100108. https://doi.org/10.1016/j.caeai.2022.100108
Ifenthaler, D., & Yau, J. Y.-K. (2020). Utilising learning analytics to support study success in higher education: A systematic review. Educational Technology Research and Development, 68, 1961–1990. https://doi.org/10.1007/s11423-020-09788-z
Islam, M. T., & Habib, T. I. (2022). Barriers of adopting online learning among the university students in Bangladesh during Covid-19. Indonesian Journal on Learning and Advanced Education, 4(1), 71–91. https://doi.org/10.23917/ijolae.v4i1.15215
Kapoor, S., & Narayanan, A. (2023). Leakage and the reproducibility crisis in machine-learning-based science. Patterns, 4(9), Article 100804. https://doi.org/10.1016/j.patter.2023.100804
Kuzilek, J., Hlosta, M., & Zdrahal, Z. (2017). Open University Learning Analytics dataset. Scientific Data, 4, Article 170171. https://doi.org/10.1038/sdata.2017.171
Mduma, N. (2023). Data balancing techniques for predicting student dropout using machine learning. Data, 8(3), Article 49. https://doi.org/10.3390/data8030049
Niyogisubizo, J., Liao, L., Nziyumva, E., Murwanashyaka, E., & Nshimyumukiza, P. C. (2022). Predicting student’s dropout in university classes using two-layer ensemble machine learning approach: A novel stacked generalization. Computers and Education: Artificial Intelligence, 3, Article 100066. https://doi.org/10.1016/j.caeai.2022.100066
Priyo, A. K. K., & Hazra, U. (2021). Understanding digital divide in online class experiences during Covid-19 lockdown in Bangladesh. North South Business Review, 11(2). https://repository.northsouth.edu/handle/123456789/326
Realinho, V., Machado, J., Baptista, L., & Martins, M. V. (2022). Predicting student dropout and academic success. Data, 7(11), Article 146. https://doi.org/10.3390/data7110146
Rets, I., Herodotou, C., & Gillespie, A. (2023). Six practical recommendations enabling ethical use of predictive learning analytics in distance education. Journal of Learning Analytics, 10(1), 149–167. https://doi.org/10.18608/jla.2023.7743
Romero, C., & Ventura, S. (2020). Educational data mining and learning analytics: An updated survey. WIREs Data Mining and Knowledge Discovery, 10(3), Article e1355. https://doi.org/10.1002/widm.1355
Shohag, S. I., & Bakaul, M. (2021). A machine learning approach to detect student dropout at university. International Journal of Advanced Trends in Computer Science and Engineering, 10(6), 3101–3107. https://doi.org/10.30534/ijatcse/2021/041062021
Suresh, H., & Guttag, J. V. (2021). A framework for understanding sources of harm throughout the machine learning life cycle. In Equity and Access in Algorithms, Mechanisms, and Optimization (pp. 1–9). Association for Computing Machinery. https://doi.org/10.1145/3465416.3483305
Tinto, V. (2017). Reflections on student persistence. Student Success, 8(2), 1–8. https://doi.org/10.5204/ssj.v8i2.376
Van Calster, B., McLernon, D. J., van Smeden, M., Wynants, L., & Steyerberg, E. W. (2019). Calibration: The Achilles heel of predictive analytics. BMC Medicine, 17, Article 230. https://doi.org/10.1186/s12916-019-1466-7
Zawacki-Richter, O., Marín, V. I., Bond, M., & Gouverneur, F. (2019). Systematic review of research on artificial intelligence applications in higher education – where are the educators?. International Journal of Educational Technology in Higher Education, 16, Article 39. https://doi.org/10.1186/s41239-019-0171-0
CITE THIS ARTICLE
Podder, S. (2026). Early Warning Systems in Higher Education: A Supervised Learning Approach to Dropout Prediction. https://www.researchbysimanto.com/article/4693b9a2-6917-4c5f-aaa7-f8eeb74e943a
S. Podder, “Early Warning Systems in Higher Education: A Supervised Learning Approach to Dropout Prediction,” 2026. [Online]. Available: https://www.researchbysimanto.com/article/4693b9a2-6917-4c5f-aaa7-f8eeb74e943a
Podder, S. (2026) ‘Early Warning Systems in Higher Education: A Supervised Learning Approach to Dropout Prediction’. Available at: https://www.researchbysimanto.com/article/4693b9a2-6917-4c5f-aaa7-f8eeb74e943a
Podder, Simanto. “Early Warning Systems in Higher Education: A Supervised Learning Approach to Dropout Prediction.” 2026, https://www.researchbysimanto.com/article/4693b9a2-6917-4c5f-aaa7-f8eeb74e943a.
Simanto Podder. “Early Warning Systems in Higher Education: A Supervised Learning Approach to Dropout Prediction.” (2026). https://www.researchbysimanto.com/article/4693b9a2-6917-4c5f-aaa7-f8eeb74e943a.
Podder S. Early Warning Systems in Higher Education: A Supervised Learning Approach to Dropout Prediction. 2026. https://www.researchbysimanto.com/article/4693b9a2-6917-4c5f-aaa7-f8eeb74e943a
@misc{article_4693b9a269174c5faaa7f8eeb74e943a,
  title = {Early Warning Systems in Higher Education: A Supervised Learning Approach to Dropout Prediction},
  author = {Simanto Podder},
  year = {2026},
  url = {https://www.researchbysimanto.com/article/4693b9a2-6917-4c5f-aaa7-f8eeb74e943a},
}
TY  - GEN
AU  - Simanto Podder
TI  - Early Warning Systems in Higher Education: A Supervised Learning Approach to Dropout Prediction
PY  - 2026
UR  - https://www.researchbysimanto.com/article/4693b9a2-6917-4c5f-aaa7-f8eeb74e943a
ER  -
In education, feature engineering can be used to enhance classification while model explanations are not addressed in terms of their meaning or reliability.In the education domain, feature engineering has been used to enhance the ability of classifiers to classify, but the meaning and reliability of the model explanations is not addressed. The difference of a methodological re-analysis of published evidence between 2017 and 2024 was explored in this study, focusing on Bangladesh. All of the quan