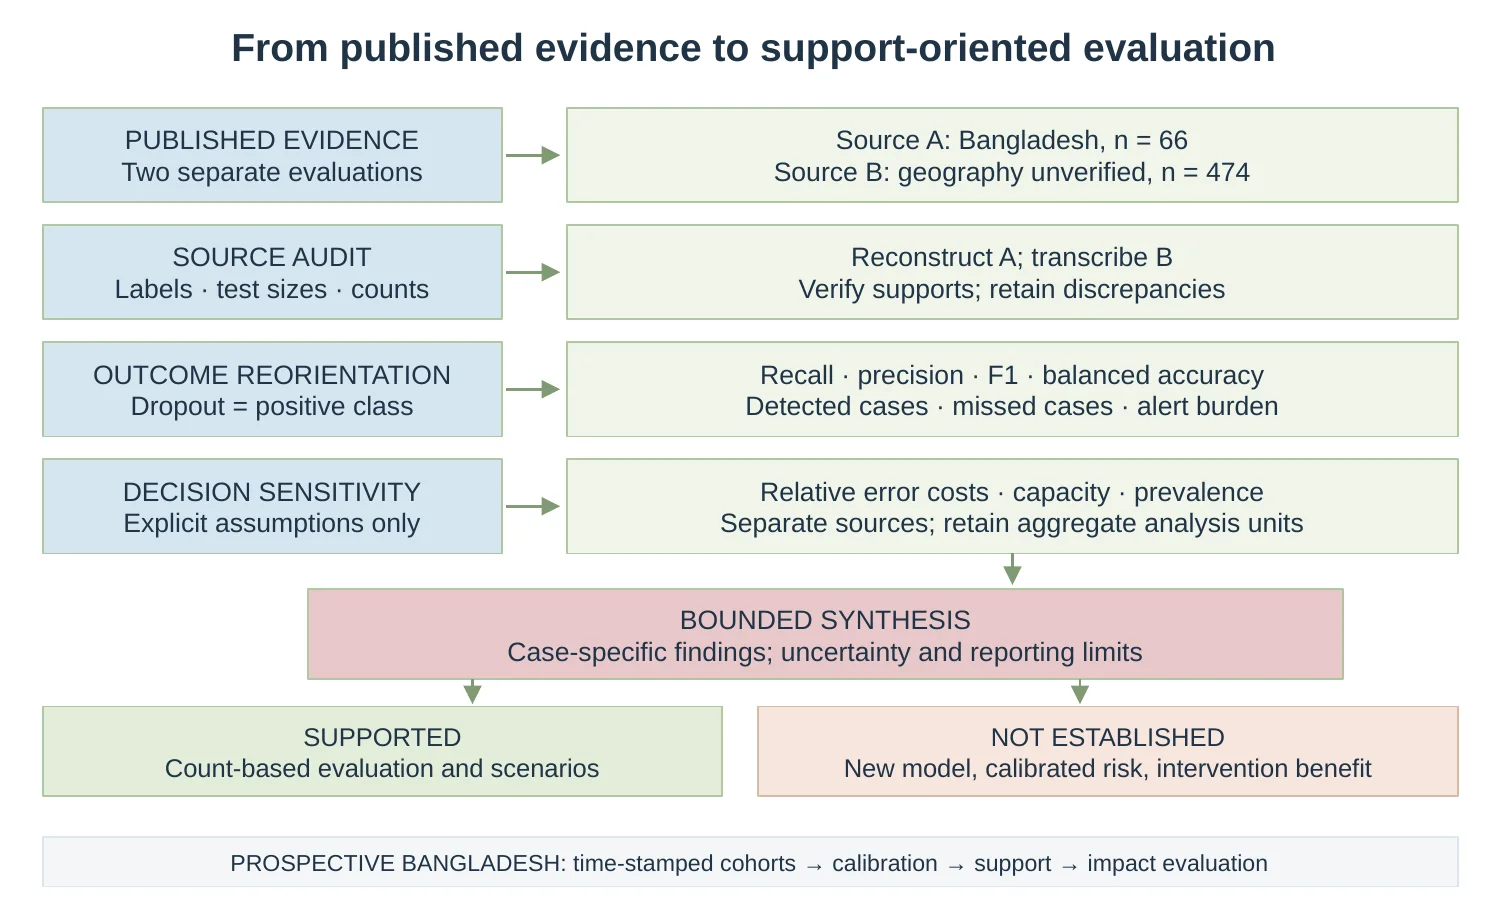
In education, feature engineering can be used to enhance classification while model explanations are not addressed in terms of their meaning or reliability.In the education domain, feature engineering has been used to enhance the ability of classifiers to classify, but the meaning and reliability of the model explanations is not addressed. The difference of a methodological re-analysis of published evidence between 2017 and 2024 was explored in this study, focusing on Bangladesh. All of the quantitative inputs consist of 36 feature cardinalities, 21 comparisons of model and encoding, 80 fold accuracies, 12 class counts, and 20 permutation-importance estimates from a programming-skills study of 1,720 students. The two additional Bangladesh datasets only provide the metadata and provide an audit of provenance. Reproducible calculations measure dimensions of the encoding task, differences in accuracy by table, composition of the resampling, differences in the fold, and sensitivity to the explanation without having to construct new student models. The published mixed-encoding rule has 129 columns, while there are 204 column under full 1-hot encoding. Random forest does not improve over one-hot encoding, while median accuracy improvements are 9 percentage points over label encoding, and 5 percentage points over one-hot encoding. Random forest is superior to stacking beats with a mean of 1 percentage point on the folds shown and one loss and three ties. The reported-spread multiplier is not assumed to represent confidence limits, rather it is sensitivity bounds and of 20 positive permutation weights, 9 are positive at one reported-spread multiplier and 4 at two. The findings support a feature to explanation audit, which distinguishes between predictive improvement, semantic validity, explanatory fidelity and educational actionability. Target construction should be documented; bilingual feature definitions should be supplied; independent validation should be done and teacher support required; not automatic.
Research ArticleEducational Data MiningIn progress
Feature Engineering and Model Interpretability in Educational Data Mining
Correspondence: simantopodder4455@gmail.com
Abstract
Keywords educational data miningfeature engineeringexplainable artificial intelligenceprogramming skillsBangladeshmodel auditingsecondary analysis
1. Introduction
Educational data mining provides representations of learning, assessment, attendance, and other learning-related data that can be analyzed and predicted. The attraction is pragmatic: institutions can glide over to patterns that it's difficult to review by studying a single student at a time. A numerical feature however is a non-neutral representation of an educational construct. The semantics, timescale and relationship between the outcome being modeled and a response of programming experience, an attendance percentage and a cumulative grade are different. They are represented as a collection of columns and the relationships that an algorithm can learn are those represented by these columns, and the meaning that an explanation can give is what is represented by these columns. Educational data mining and learning analytics, therefore, presents a significant aspect to take into account, especially the representation and prediction of educational data (Romero & Ventura, 2020).
Feature engineering is often touted as a way of making the model more accurate. This includes the decisions of reconciliation between categories, of coding nominal answers, of keeping information in an ordinal form, of aggregation of repeated observations and dropping of information that is missing on a prediction. These decisions can also impact the relative importance of features as reported. For instance, putting an unordered response as an integer provides some models with an artificial geometry and expanding the response into indicator columns alters the unit over which the importance is distributed. These elements must therefore be involved in the search for a meaningful interpretation: the identification of the original construct or construct, and how this has been changed, plus the model behaviour being summarized. There are not just one to one indicators of quality, such as predictive accuracy, descriptive faithfulness and relevance to an audience (Murdoch et al., 2019)
It has significance in the context of Programming education in Bangladesh. The data set that is published has 1,720 computer science and engineering students, 36 features, and four classes of the students' proficiency in the programming. The source lineage begins with the classification and feedback system, followed by an exploration of alternative encodings, resampling, stacking and explanation tools (Islam et al., 2024; Marjan et al., 2023). The variables are course results, problem solving experience, contest participation, technical knowledge and habits reported by the participant. These features are educationally identifiable, but not identification equals preserving of meaning, not identification equals better learning from the coding of a highly ranked feature.
This is also relevant to the difference between a classification of the status of the child and a prediction of what the child's status will be in the future. A model may predict the achievement level of a skill category at one time only, and not predict future skill achievement. The result might be partly constructed from the same measurements provided as predictors, in which case, the task may be a scoring game instead of finding out independent prognostic information. In one such description of a repository in Bangladesh, there is a particular link between the target of student status and current grades and behaviour. The documentation does not provide evidence of any Bangladesh dataset having circular labels (Rahman et al., 2024) although it does provide a rationale for the auditing of the construction of the targets. The correct answer isn't a blanket allegation of leakage, it's source specific inspection.
The tools in interpretability research can be used to study learned relationships, however, the addition of an explanation tool to a model is not a solution to all of these problems. Different quantities are summarized by local attribution, global contribution aggregation and permutation importance. For a particular answer to a particular prediction, a local explanation, a population-based answer to a particular prediction, a global ranking, and a particular perturbation of a scoring function, an answer is given. But, when it comes to one-to-one educational recommendations, explanations can be misunderstood. On the other hand, the purpose, audience and scope of an explanation should be defined and specified first to assess the visual appeal of the explanation (Khosravi et al., 2022; Lipton, 2018).A methodological gap ensues. Predictive scores from published educational studies can be used for comparison purposes but cannot be sufficient to demonstrate the stability, semantic validity and/or actionability of explanations about education. The merit of the available programming-skills case from Bangladesh is that it provides a number of supporting tables. These enable an independent quantitative audit to be carried out without the need to obtain private student records. It's not about creating another list of classifiers. It is to explore the impact on conclusions of: (1) encoding contrasts, (2) model-comparison margins, (3) category composition, and (4) explanation spread separated from each other, with denominators made explicit (Islam et al., 2024).This study fills that void by employing a critical synthesis and a descriptive secondary reanalysis. The empirical contribution consists of a series of calculations derived from the empirical data and reconstructs the dimensionality of the feature space, computes encoding gains in a common reported table, investigates the comparison margins at the fold level and tests the sensitivity of the reported importance scores. The methodological contribution is a feature to explanation audit (FTEA) which asks four questions: 1) does the representation predict; 2) is the construct preserved in the representation; 3) is the explanation faithful to the model; and 4) does information in the explanation contribute to an educational decision. The audit is an operational framework based on the principles developed for interpretability, and is not a validated certification instrument (Murdoch et al., 2019; Rudin et al., 2022)
The Bangladesh contribution is not merely based on the assumed number of students in the country but on the empirical case selected and on two records from the repository. There are also practical issues with the wording of the surveys, as well as institutional coverage and availability of features (old vs. new grades). The concerns are embedded in a larger educational argument: Prediction systems are not pedagogical judgements, they are a component of teaching and supporting the student. Prior reviews have taken place over weeks and years; and studies in the field of adaptive-learning have indicated discrepancies between the proposed systems and the educational benefits (Kabudi et al., 2021; Zawacki-Richter et al., 2019)
The analysis is organized in four questions. The categorical-encoding rule is explored in RQ1 with respect to its dimensionality and to its interpretation of the feature space. The second question (RQ2) is concerned with the accuracy difference of the different encoding alternatives, and the effect of the preferred representation on the different classifiers. RQ3 aims to explain findings of the resampling and fold limit claims of comparative reliability. RQ4 is asking what are the "defendable" interpretations when the importance spread and the available provenance are reported. A causal learning improvement hypothesis is not tested in these questions which are description and methodology.
2. Literature Review and Conceptual Foundation
2.1 Feature engineering as educational measurement
There are a number of information sources that could be used to support educational data mining, but predictive usefulness should be differentiated from the validity of measurement. A variable can predict because it is a measurement of the construct of interest; because it is a convenient substitute; or because it contains information that is very similar to the information used in the construction of the label. Different meanings for the numbers can then be attached. Broad surveys situate educational data mining in the context of an analysis-to-support process, thus the educational question is a suitable starting point for the selection of features and not an explanation added after model selection (Romero & Ventura, 2020).
This is a problem with categorical features. There will not be an explicit order of categories introduced by one-hot encoding, but there will be an increase in the number of columns in a construct and it will be broken across indicators. While scalar label encoding is compact, arbitrary integer labels can create inappropriate distances in distance-based or linear models, and/or limited partitions in trees. Only when there is a good substantive claim to the order of the representations can the ordered representations of genuine ordinal categories be used. Without additional information on the number of strings, it cannot be determined if “sometimes”, “no” and a description of a different library for programming are on the same proficiency scale. This is an argument about measurement, not that one encoder is the superior one.
The second issue is the timing. Any features which can only be observed after an examination cannot be used to support a prediction before the examination. Similarly, if rules are imposed on the preprocessing phase for the evaluation set, “unseen” can be changed. Leakage research can be identified as leakage that may occur in a pipeline because of inappropriate evaluation design, target construction and pre-processing (Kapoor & Narayanan, 2023)The other extension that should be recorded for learning purposes is when the feature was added and why it was added. This yields a feature dictionary that must differentiate features of prior attainment, features of the behavior as it takes place, features of administrative outcomes, features of protected or sensitive context.
2.2 Interpretability requires a specified question
In the literature there are two types of models: inherently interpretable models and explanations of complex models in terms of simpler ones. An interpretable specification could allow for a direct inspection of the learned rule, while a post hoc method gives an extra description that needs to be evaluated for fidelity. Simple and complex are not necessarily the solutions: a simple model that is given an unintelligible feature might be hard to use. This is because the case for the interpretable models is best viewed as a test of whether there are simpler models that are interpretable, rather than a proposition that any nonlinear model is not acceptable.
The features in a Coalition structure or Defined reference are attributed by additive attribution methods. SHAP offers a standard way to make such contributions and local tools to translate from local attributions to global summaries (Lundberg et al., 2020). Such changes are not considered a ranking equivalent intervention effect. For example, mean absolute attribution does not take into consideration direction, it is about the level of contribution. A feature could be a good predictor for some predictions, and a bad predictor for others, or be different for sub-groups. Must be able to see the aggregation population and the grouping that was done with the original features.
There is an interdependence of educational predictors, which makes interpretation more difficult. It is possible that prior attainment and problem solving experience and self-rated understanding overlap. More loosely, the combinations created by permuting one variable may not be very well represented in the data set, and methods of attributing which assume the independence of the variables can produce poor attributions. The dependence-aware Shapley approximations address different, but related, problems and should not be claimed until implemented (Aas et al., 2021; Apley & Zhu, 2020). Unrestricted permutation research also demonstrates the importance of marginal importance as an extrapolation as well as a variable's predictive value (Hooker et al., 2021).Explanation fidelity must be also tested not the inference from plausible display. Adversarial work is provided to show that, for certain conditions contrived by the adversary, some perturbation-based explanations can mask undesirable model behavior (Slack et al., 2020).That does not imply that there was no evidence of manipulation in Bangladesh. It sets an overall basis for evaluating explanation methods without regard to the specific context. An explanation that appears reasonable should thus be subject to debate, correction, and comparison with the evidence of learning from the classroom in use in the school.
2.3 Accuracy, uncertainty, and educational relevance
The accuracy of classification is an overview of the proportion of correct labels for a given evaluation distribution. It doesn't say anything about calibration, about clustering of forecasting errors in a subgroup, or about a gain from implementing a forecast. The benefits of the separate assessment of ranking performance and the reliability of probability estimates are demonstrated in calibration studies (Guo et al., 2017; Van Calster et al., 2019). In this case these sources are only utilized for the purpose of making statistical difference, and their empirical results are not utilized for students of the Bangladesh students and calibration is not reconstructed from the published empirical accuracy tables.
Another difference is to cross-validate. The evaluation runs shown would be fold-to-fold but the same training runs would not be able to be used as fold to be counted as an independent deployment. It is also important to take into account the precision reported by the models, as there are some minor differences between them. While reported in the literature, cross-validation uncertainty may serve as an alarming cautionary note against presenting the standard error over folds as a complete measure of the generalization uncertainty (Varoquaux, 2018).On the other hand, secondary audits leave no doubt about arithmetic, and include bounds for rounding; the bounds for the learner-level confidence interval are more defensible.
Audiences and consequences are added to the explanation design for education. Different information is needed by an instructor(s) debugging a feature pipeline, a student asking for feedback, and an administrator allocating support. This contextual design problem is emphasized in the context of educational XAI frameworks (Baker & Hawn, 2022; Khosravi et al., 2022; Suresh & Guttag, 2021) and in research on algorithmic bias, harm is considered a life cycle problem and not just a measure .A feature that can predict well, but encodes an unequal provision of institutional support may be of assistance in auditing provision of institutional support, and may not be suitable to criticise an individual student for not having it.
2.4 A feature-to-explanation audit
The construct, representational, predictive, explanatory assessment, and support decision linkages that follow are used in the framework. The very first is semantic: the feature and the outcome must have a defensible meaning and time of availability. The second is empirical: the representation needs to be tested against alternatives given in known conditions. The third is explanatory: the estimator, the scoring function, the background distribution and the uncertainty of the explanation need to be expressed. The fourth is practical: a teacher needs to make the explanation accessible to a practical, proportionate reaction. These gates build on predictive, descriptive and relevance principles and add a source auditable educational workflow (Murdoch et al., 2019).The following analysis examines some of the aspects of the second and third gates and checks some of the documentation for the first gate. Does not numerically estimate learning gains at the fourth. This separation renders it impossible to present proposed practices for support as completed experiments. It also can fit informative negative results: an encoding tie, a small comparison margin, or a feeble importance sign can support a decision by indicating where a claim ought to be narrowed. When it comes to educator responsibility and equitable access, there is evidence that will need to be translated into policy guidance, the building blocks of which will be human-centred (Miao et al., 2021).
3. Methodology
3.1 Design and evidence boundaries
A combination of a critical methodological synthesis and descriptive re-analysis of the quantitative summaries that have been published publicly was used. The publication period was from 1 January 2017 up to 31 December 2024. Source discovery and verification was conducted on 7 October 2026 – this is not a later retrieval date, and therefore does not expand the window of eligible evidence. The following two searches focused on the issues of Bangladesh educational data mining, programming-skill classification, categorical encoding, explanation fidelity, leakage, calibration, and educational equity. Priority was given to the publisher pages, author records, proceedings and description of the official repository. Twenty-five sources were chosen that were directly relevant to the empirical or methodological context.
This is not a registered systematic review or a comprehensive record of the database or a meta-analysis. Totals, duplicate screening and PRISMA exclusion numbers were not restored. The principal quantitative case was chosen as it is jointly reporting cardinalities of features, encoding ablation, fold accuracies, counts of classes, and weights of explanations. It was specified using interpretation literature what these summaries can and cannot support. There are only two Bangladesh repository documents for setting context. They are not extra samples of learners' level that are available in the field of numerical analysis (Islam et al., 2024; Prama, 2024; Rahman et al., 2024)3.2 Data sources, provenance, and analytical sample
Table 1 Table 1 describes the sources and analytical units. According to the original programming-skills data set, there are 1,720 students and 36 predictors, but the data analyzed here are data in published tables. The quantitative extraction includes 36 cardinalities (Table 2), 12 class counts (Table 3), 80 displayed fold accuracies (Table 13), 21 model–encoding rows and their associated 4 metric values (Table 15) and 20 importance weights and their associated 20 spread values (Table 16). Such quantities cannot be combined as the "students sample size" (Islam et al., 2024)Table 1. Evidence sources, extracted units, and analytical boundaries.
| Source / version | Published material and coverage | Use in this study |
|---|---|---|
| Islam et al. (2024) PLOS ONE, e0307536 Tables 2, 3, 13, 15, 16 | Bangladesh programming-skills case describing 1,720 CSE students. 36 cardinalities; 21 model–encoding cells; 80 fold accuracies; 12 class counts; 20 weights plus spreads. | Quantitative reanalysis of published summaries. Units are table cells and features, not new students. No raw records, probabilities, or training artifacts were analyzed. |
| Rahman et al. (2024) Mendeley Data, V1 10.17632/dc3797vf3t.1 | Repository describes 1,195 rows and 31 columns from a private-university CSE survey in Bangladesh; published 16 September 2024. | Metadata-only audit of target construction and variable availability. The workbook and its numerical outcomes were not analyzed. |
| Prama (2024) Mendeley Data, V2 10.17632/ns87rtkv58.2 | Repository describes 894 IUBAT students; published 4 November 2024. Title suggests selected universities, whereas the description names one. | Metadata-only geographic and documentation audit. Collection dates and overlap with other records are unverified; no cohorts were merged. |
The lineage article has been kept to explain that the later study utilizes a pre-existing programming-skills dataset, instead of providing an independent replication sample (Marjan et al., 2023). Neither raw student records nor trained estimators were obtained for this reanalysis. Descriptions of the repositories were read directly, but the workbooks that support the repositories were not analyzed. In this regard, the 1,195 respondents who were described by Rahman and colleagues and the 894 described by Prama were not pooled together or with the programming case. However, overlapping institutions, multiple response, and definition of the target remain untouched (Prama, 2024; Rahman et al., 2024)
The tables within the source article were transcribed from parsed publisher-supplied text, and verified against the accessible narrative text and table labels. Unable to retrieve screenshots for PDF file, therefore no cell-by-cell visual audit of source PDF was performed. The package includes the source table identifiers, the original values, and interpretation notes for independent checking. Programmatic checks test for row counts, uniqueness, rates, class counts, and consistency of calculations. The checks note any transformation errors, but do not verify that the original research design has been adhered to or be a substitute for author review of the transcription.
3.3 Feature representation and dimension reconstruction
Let We will denote the number of categories published for the predictor j by Kj. One hot encoding with all category indicators results in DOHE = ΣjKj, and scalar label encoding results in 1 column per predictor. The published mixed rule states that one-hot encoding is used for Kj < 7 and scalar encoding otherwise. Thus, its implied dimension is D(τ) = Σj {Kj if Kj < τ; 1 otherwise}, for τ = 7. The four categories of the target are ignored. It is an algebraic reconstruction that is not an inspection of a fitted transformation matrix (Islam et al., 2024).
D(τ) = ∑_(j=1)^36〖[K_j I(K_j < τ) + I(K_j ≥ τ)]〗 (1)
The sensitivity of the threshold for integer τ was tested for the entire reported range of cardinality 2 to 23. A second convention discards one of the reference indicators in each one-hot feature. These alternatives estimate representational implications of an explicit coding rule, not predictive performance at yet-to-be-tested coding thresholds. According to the source, there are 22 categories in the programming-learning period, but it shows fewer examples. The number has been kept and marked with a flag instead of being silently replaced. The published cardinalities do not show the rare-category pooling, unknown-category handling, or the availability of categories in a particular fold.
3.4 Within-source performance and composition analysis
Comparisons are only encoded from Table 15 of the source. For every classifier, accuracy differences (100 times the mixed accuracy minus comparator accuracy) were computed in percentage points. am and bm are the parameters for the accuracy in mixed-encoding and comparator accuracy, respectively. The reduction in accuracy is where the difference in accuracy is divided by the error rate of the comparator. This extra ratio is useful to differentiate a small absolute improvement at the accuracy limit from a large error change from the error remaining. It is not an assessment of the improvement of a student's learning nor an educational risk-reduction. Median contrasts are meant to provide summary descriptive information on the seven listed classifiers, and not to calculate an average treatment effect over independent studies.
Δ_m = 100(a_m - b_m); RER_m = Δ_m/(1 - b_m ) (2)
All Table 15 accuracy values have two decimal places. Each value is assumed to be rounded to the nearest 0.01 and has an envelope of ±0.005 (a conservative envelope); each difference has an envelope of ±1 percentage point. These deterministic bounds reflect display error, not the uncertainty of the samples. Other source tables did not have all of their results substituted where they differ. Specifically, a random-forest accuracy is mentioned in a different part of the article: 0.95 (mixed-encoding), while the encoding ablation is 0.94. This audit stores the table specific values, but does not make any assumption about the runs or harmonizing them silently (Islam et al., 2024)
The composition of the classes was rebuilt separately under the original, SMOTE, and NearMiss conditions. An initial count of all records is supplemented with reported totals of resampled records, which are matched with the initial count to identify whether that is a record that was added or one that was retained as an observed record. No resampling algorithm was run. The change in the number of rows does not necessarily imply that more new information is being added. The order in which the data is split, encoded, and resampled cannot be checked in isolation, since the extraction does not contain the sequence of pipelines that were preprocessed on the data. Hence, potential leakage and category-validity concerns are noted as verification requirements rather than actual failures (Kapoor & Narayanan, 2023)
3.5 Fold-level comparison and explanation sensitivity
The ten displayed accuracy values for each of eight classifiers were summarized using their arithmetic mean, sample standard deviation, minimum, and maximum. The printed source average was retained alongside the recalculated mean. Differences can arise because displayed fold values are rounded or because the reporting procedure is incompletely specified; a discrepancy is not automatically classified as a calculation error. Stacking-SRDA and random forest were compared by corresponding displayed fold labels. Counts of wins, ties, and losses and leave-one-fold-out mean differences describe this table, conditional on those labels being comparable.
No fold-level t-test, learner bootstrap, or reconstructed McNemar test was performed. Shared training information and absent joint prediction records prevent those tables from supplying an independent sample of deployment effects. The standard deviation is labeled fold variability rather than a confidence interval. Leaving out one displayed fold is an arithmetic sensitivity check, not external validation or a corrected estimate of generalization uncertainty (Varoquaux, 2018).For each reported permutation weight wj and accompanying ± quantity sj, sensitivity envelopes were defined as [wj − c sj, wj + c sj]. Multipliers c ranged from 0 to 2 in increments of 0.25. The analysis counts strictly positive lower envelopes among the 20 displayed features. The source does not provide enough information to establish the exact statistical interpretation of its ± values; therefore, sj is called the reported spread. Multipliers are transparent analytical assumptions rather than confidence levels, and no probability is assigned to a particular envelope (Islam et al., 2024)
L_j(c) = w_j - c s_j; N(c) = ∑_{j=1}^{20}I(L_j(c) > 0) (3)
Negative lower values were retained, not truncated. A zero reported spread remains zero in these calculations but is not interpreted as proof of zero uncertainty. The 16 predictors absent from the importance table are unreported, not zero-importance features. A supplementary set comparison contrasts the five leading features named in the Shapash narrative with the first five in the permutation table. The intersection and Jaccard ratio describe overlap only. Because the explanations need not estimate the same quantity on an identical population, disagreement is not treated as a formal test of either method (Hooker et al., 2021; Lundberg et al., 2020).
3.6 Synthesis, reproducibility, and decision boundaries
Figure 1 summarizes the executed workflow. The analysis script reads source-coded CSV files and generates all derived tables and chart data. It performs no supervised-model fitting, SHAP or LIME computation, probability calibration, or causal estimation. Model names in the results identify the original study’s classifiers. Versioned source links, extraction notes, data checksums, and outputs are supplied so that arithmetic can be rerun and contested independently.
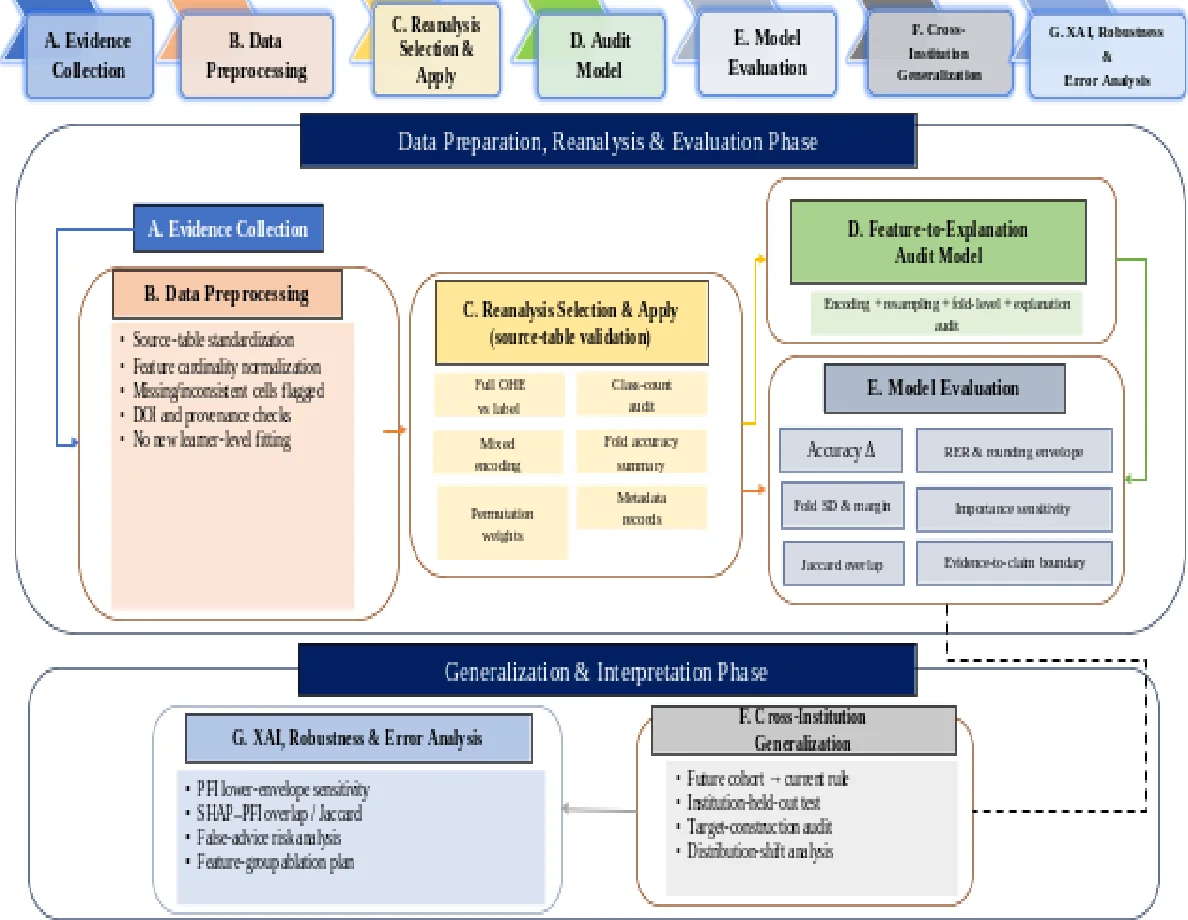
Figure 1 summarizes the executed workflow. The analysis script reads source-coded CSV files and generates all derived tables and chart data. It performs no supervised-model fitting, SHAP or LIME computation, probability calibration, or causal estimation. Model names in the results identify the original study’s classifiers. Versioned source links, extraction notes, data checksums, and outputs are supplied so that arithmetic can be rerun and contested independently.
4. Results
4.1 Encoding compresses columns without resolving category meaning
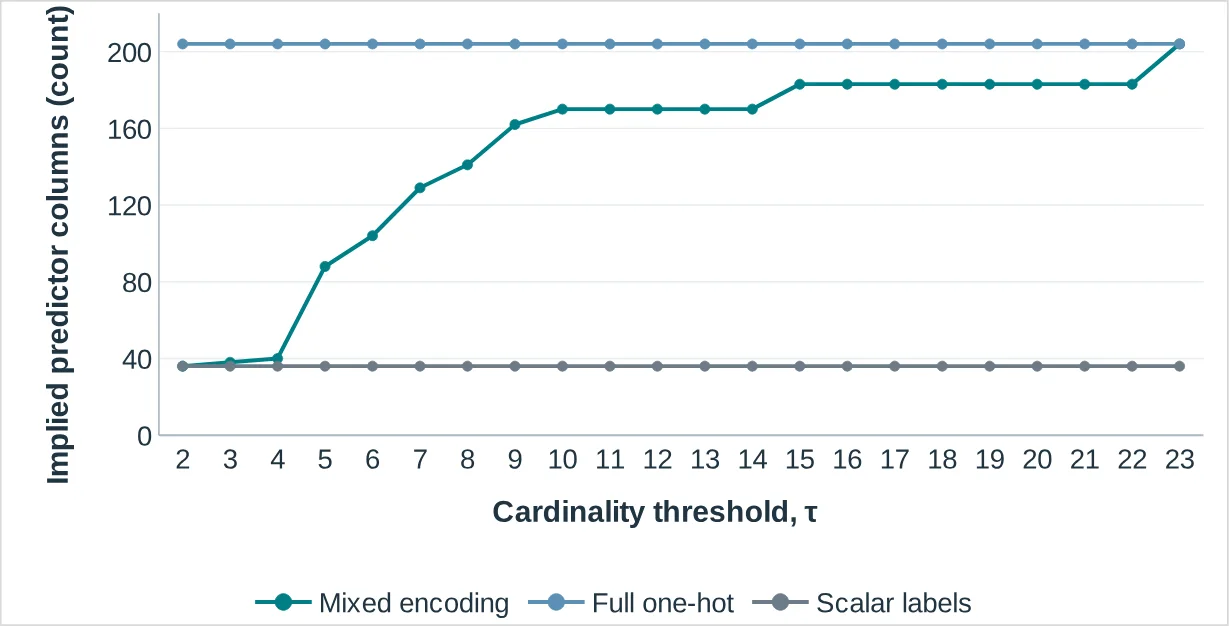
The total sum of all the published cardinalities is 204. By the strict threshold rule Kj<7 each predictor is one-hot encoded and 8 are given a scalar code, resulting in 129 columns. This is 36.8% less than the full-length one-hot representation (204 columns), but not as much as the 36-column scalar representation. For a total of one-hot predictors, there are 28, which will become 101 columns after dropping one reference category from each predictor. They are hypothetical dimensions based on a convention, not on memory usage or on training duration.
The threshold-feature space size relation is not linear, as depicted in Fig. 2, but is stepwise. At τ = 7, the scalar-coded group is comprised of programming-learning period, architecture knowledge, algorithms, data structures, STL use, creativity, coding understanding, and debugging. By shifting the threshold, one changes what constructs in education will be given a ranking, and not just a storage adjustment. It should be noted that the category examples do not provide a common scale of defensible ordinal placement for all eight constructs (Islam et al., 2024).
Source feature names also need to be taken care. The six categories for proficiency are reported as a problem solved number instead of a directly reported continuous count. It would, then, lose its significance if the label were interpreted as indicating a fixed number of solved problems. The 14-category STL variable is a composite of affirmations, non-use, uncertainty and descriptions of other library practices. These details of documentation aid in conducting a semantic audit prior to fitting or explaining a model but do not provide any quantification of the impact that any alternative recoding would make to the accuracy.
4.2 Encoding gains are heterogeneous across classifiers
Compared to label encoding, mixed encoding increases the accuracy of the SVM model by 9 points, the decision tree model by 7 points, the naïve Bayes model by 21 points, the ANN model by 19 points, the KNN model by 13 points, the random forest model by 3 points, and stacking by 2 points in the published ablation table. The median is 9 % points. The corresponding gains against one-hot encoding are 12, 1, 15, 5, 9, 0, and 1 points (median 5). This means that the source gives benefits to a specific model, rather than all classifiers (Islam et al., 2024).
Two qualifications are evident in Figure 3. Random forest achieves the same performance with both one-hot encoding (94%) and mixed encoding (94%), while SVM has a worse performance with one-hot encoding than with label encoding (93%), but performs better under the mixed rule. The absolute drop in displayed error rate is 1 point and the relative drop is 20% when compared to one-hot encoding, with a stacking accuracy of 95% to 96%. These are merely alternate ways of describing the same contrast and should not be used interchangeably.
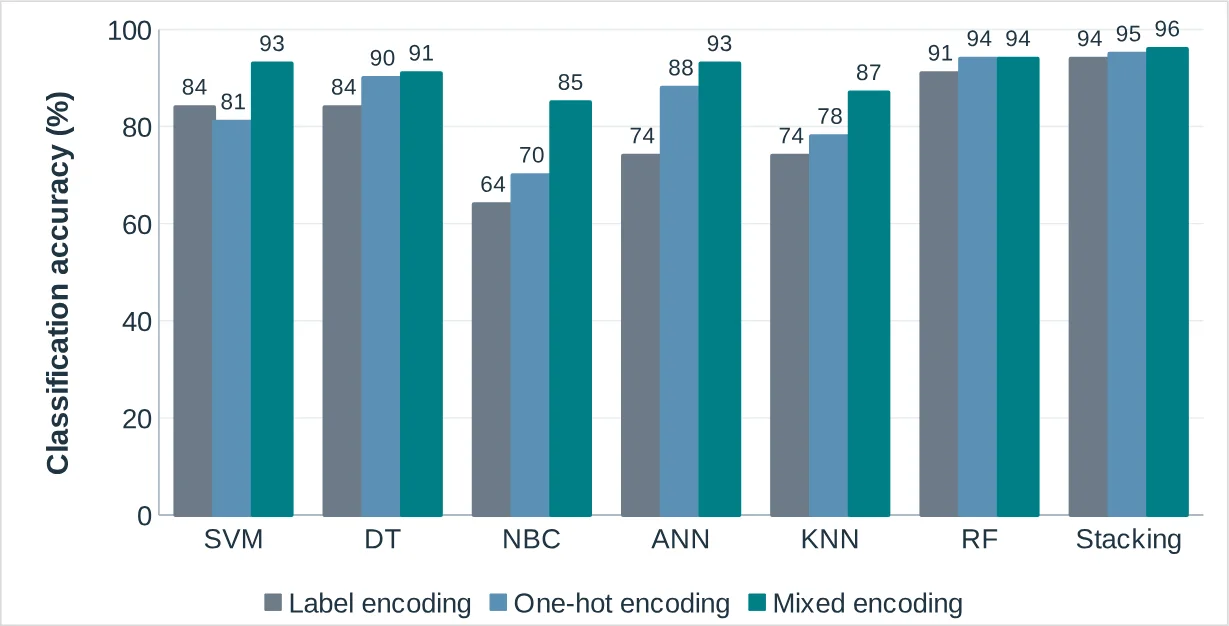
The most important aspect of rounding sensitivity is for small differences. The stacking and decision-tree gains are conservative display-precision envelopes of 0-2 points when compared to 1-hot encoding; the random-forest tie is an envelope of −1 to 1 point. The rounding analysis shows that the larger gains for SVM, naïve Bayes, ANN and KNN are positive. Such bounds do not prove statistical significance nor do they take into account variation of retraining. They demonstrate why there is no sharp universal ordering that can be obtained from a mere determination of precision in the print.
4.3 Resampling changes representation, not independent enrollment
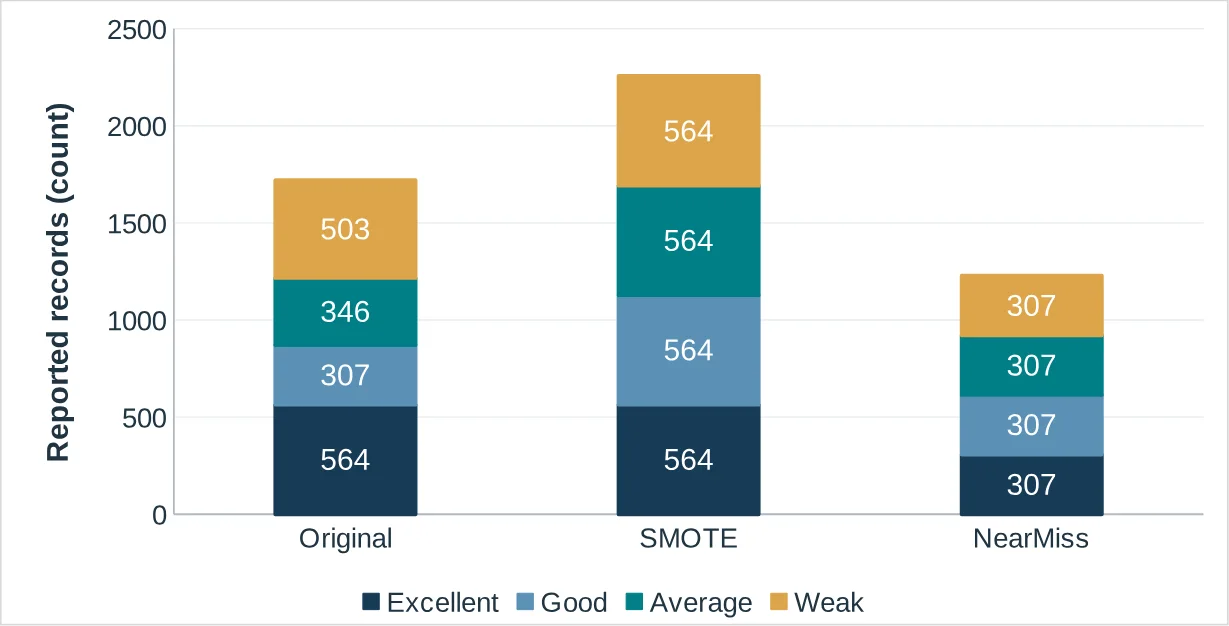
There are 564 Excellent, 307 Good, 346 Average and 503 Weak records in the original class distribution. Their respective shares are 32.8%, 17.8%, 20.1%, and 29.2%. The reported SMOTE condition allocates 564 records per class, for a total of 2,256, while NearMiss allocates 307 records per class, for a total of 1,228. These represent 536 additional synthetic rows or 492 fewer rows that were kept in the original table. Both are not a new sample of recruited students (Islam et al., 2024).
Figure 4 illustrates both procedures are 25% representation per class using different operations. Equal class proportions are thus not equal evidence provenance. If not for the original pipeline, the aggregate counts would not have been able to determine if any synthetic pipeline records were kept within training folds or if any categorical constraints were maintained. They do set the denominators for any reported “resampled” results.
4.4 The stacking margin is modest at fold level
Naïve Bayes is 86.4%, random forest is 94.1%, and the mean of all the classifiers is 95.1%. The same printed corresponding averages and fold standard deviations are provided in Table 2. The logistic-regression values displayed are an average of 91.3% and printed 92%. This is not enough to indicate that there may have been a computational error; it's merely an arithmetic mismatch of the summary displayed, and the fact that no averaging procedure or unrounded fold values are available.
Table 2. Recalculated summaries of the published ten-fold accuracy table.
| Model | Mean (%) | Fold SD (pp) | Range (%) | Printed mean (%) |
|---|---|---|---|---|
| LR | 91.3 | 3.77 | 86–97 | 92 |
| SVM | 93.3 | 1.83 | 90–96 | 93 |
| DT | 88.8 | 2.49 | 85–93 | 89 |
| NBC | 86.4 | 3.06 | 82–92 | 86 |
| ANN | 92.9 | 2.23 | 89–97 | 93 |
| KNN | 87.9 | 2.08 | 85–92 | 88 |
| RF | 94.1 | 1.45 | 93–97 | 94 |
| Stacking | 95.1 | 1.66 | 92–98 | 95 |
Note. Source: Islam et al. (2024), Table 13. SD is the sample standard deviation of ten rounded fold accuracies, in percentage points (pp), not a standard error or confidence interval. Printed averages are retained rather than overwritten.
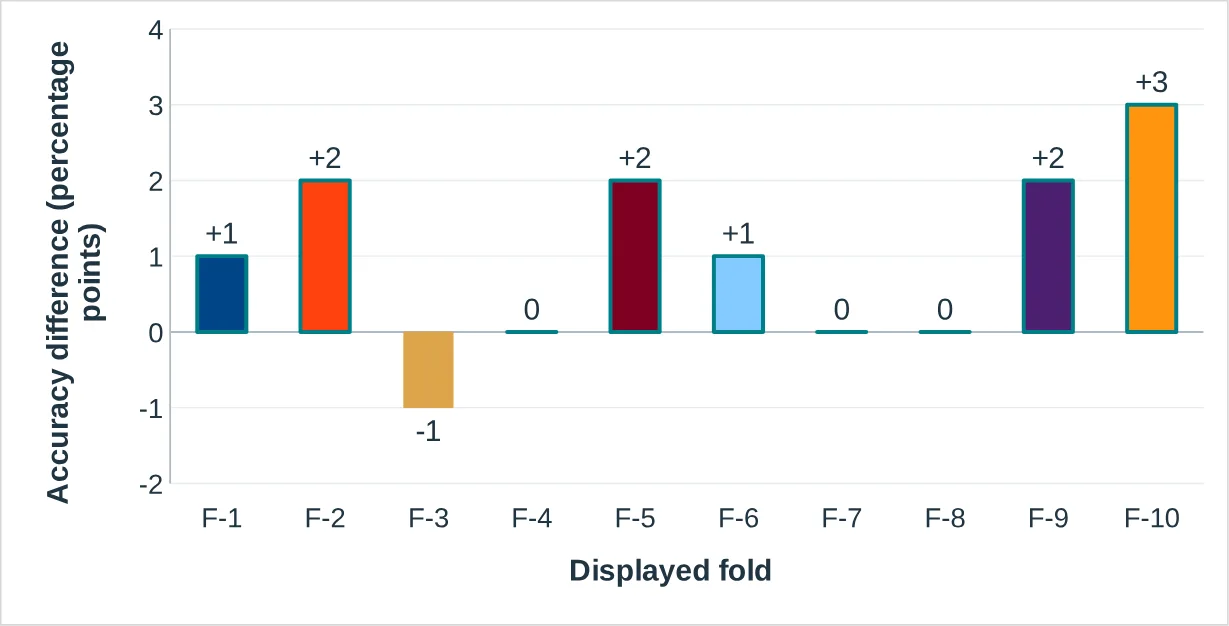
The differences between the stacking and the random forest methods are 1, 2, −1, 0, 2, 1, 0, 0, 2, and 3 points per cent on the ten labeled folds. He leads in 6 games and ties in 3 games and trails in 1 game. When one fold is not shown, the mean advantages range from 0.78 to 1.22 points; when it is shown, its mean advantage is 1 point. These results confirm that, on average, using a minimizer results in a small benefit, rather than in an overall victory, as reported in the table.
Figure 5 shows the losses and larger gains, not an average. The pattern can be used for useful predictive improvement, but it does not provide a confidence interval for an institution implementing the pattern. The leave-one-fold-out range and the fold range do not measure cross-university, future-cohort or subgroup transportability. Other data are necessary to evaluate those claims.
4.5 Positive importance is not uniformly stable to reported spread
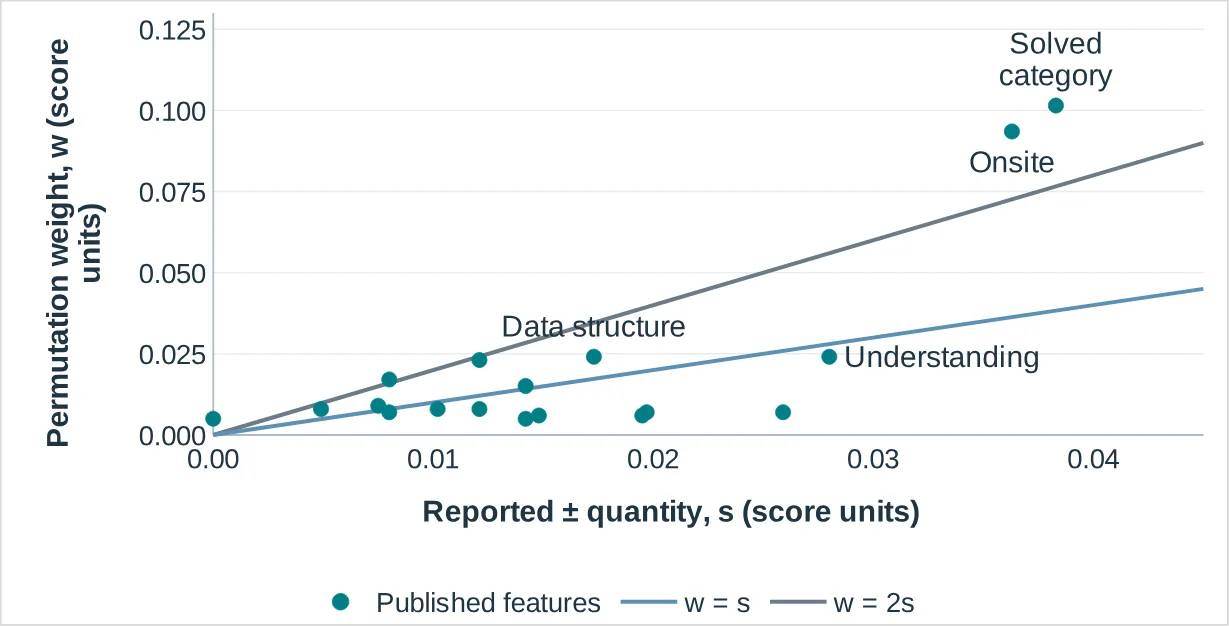
The heaviest displayed permutations are in the problem solved category (0.1015) and in onsite participation (0.0935). Their accompanying spread values are 0.0383 and 0.0363. The sum of the two weights is 50.2% of the sum of the 20 displayed nonnegative weights. This is a concentration statistic, not a proportion of variance in outcome explained, and the 16 unreported predictors were not in the denominator (Islam et al., 2024).
Figure 6 is a separation of the central values from the reported spreads. While both coding understanding and data-structure knowledge are equally weighted, their bottom envelopes are not the same; one-spread lower, respectively, for coding understanding: −0.0039 and data-structure knowledge: 0.0068. The lower envelope of both the problem solved and the onsite participation categories are positive at that multiplier, but the coverage of the two categories do not create a distinct ordering of the first and second places. If an answer were given in a rank only fashion, both differences would be obscured.
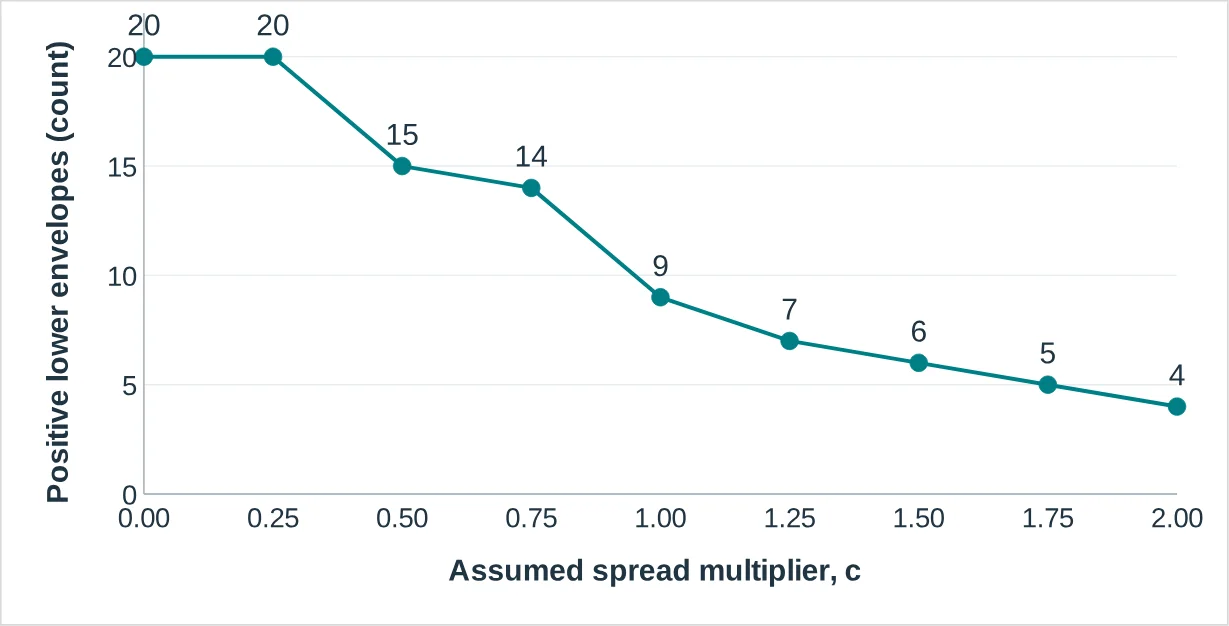
All 20 central weights are positive. The number with strictly positive lower envelopes falls to 15 at c = 0.5, nine at c = 1, six at c = 1.5, and four at c = 2. At the final multiplier, the positive set contains problem-solved category, onsite participation, real-life problem-solving skills, and learning method. Learning method survives partly because its printed spread is zero; that arithmetic property should not be interpreted as exceptionally strong empirical certainty.
Figure 7 is a sensitivity profile and is not a replications curve. It depicts the rate at which the claim “this feature has positive reported importance” is dependent on the width of an explicitly selected envelope. The profile does not show the joint distribution of importance estimates, nor does it show the impact on a new cohort from retraining. Rather, it pinpoints areas where further information-uncertainty reporting would be most beneficial.
The top-five Shapash features are shared in terms of problem-solved category and onsite participation, but not in terms of the actual features. There are 2 overlaps with 5, which equates to a Jaccard ratio of 0.25. This isn't proof that either is incorrect because they are all summarizations of various kinds of model behavior. It demonstrates that when there is a generic statement of “the five most important factors”, then the method and aggregation rule is missing from that statement.
4.6 The contextual records limit prediction and geographic claims
The Rahman repository represents a selection of current grades, attendance, study patterns, social-media time and English proficiency. A high rate of classification also does not imply a forecast of an independent future outcome when a status label is based on candidate inputs; the wording of the status label evokes a construction target. The Prama record includes the names of universities in its title but includes data for 894 respondents across IUBAT. This audit adopts the more specific collection context given instead of assuming multicampus coverage (Prama, 2024; Rahman et al., 2024).
These are not model-performance findings, but rather metadata findings. No inconsistency in the underlying spreadsheet was measured, no duplicated participant was found and no fairness gap was estimated. Table 3 presents a conversion of the numerical and documentation findings to specific verification requirements and leaves the issues not addressed distinct from the errors found.
Table 3. Evidence-to-claim boundaries for educational interpretation.
| Audit question | Supported finding | Required before a stronger claim |
|---|---|---|
| Does mixed encoding reduce dimension? | 129 versus 204 implied columns under the stated full-indicator convention. | Verify the actual matrix, category semantics, and computational measurements. |
| Does it improve every classifier? | Positive displayed gains against label encoding; a random-forest tie against one-hot encoding. | Nested, identically partitioned validation with uncertainty for paired outcomes. |
| Is stacking uniformly superior? | Mean fold margin of 1 pp; six wins, three ties, and one loss against random forest. | Future-cohort and institution-held-out validation, including subgroup performance. |
| Does balancing enlarge the evidence base? | SMOTE adds 536 synthetic rows; NearMiss retains 492 fewer rows. | Confirm training-fold isolation and valid categorical combinations. |
| Are positive feature weights stable? | 20 positive central weights become 9 and 4 positive lower envelopes at c = 1 and 2. | Defined uncertainty, repeated fits, and dependence-aware explanation checks. |
| Do explanations justify advice? | A ranking describes fitted-model behavior, not the effect of changing a student’s circumstances. | Educator/student evaluation and a separate intervention design. |
5. Discussion
The key discovery is that there must be a joint audit of feature engineering and interpretability, even when the result of classification is good. The mixed rule lessens the dimensionality of the data compared to a full one-hot encoding and makes the most accurate within-table comparisons, but both do not prove semantic correctness. Its use of categorical expansion vs. scalar coding depends on the cardinality while defensible measurement depends on the meaning of categories. This difference is most apparent in responses that include levels of knowledge, uncertainty, and descriptions of practice. This facilitates more compact encoding to coexist with less transparent relationship between feature and its educational construct.
The results do not invalidate the contribution of the original study, but rather further qualify it. The inclusion of encoding alternatives and explanation values allows for scrutiny of the encoding, which an isolated headline accuracy would not allow. The result of the reanalysis shows significant intra-table improvements in some of the combinations of classifiers-encoding. It also points to a tie for the random forest and slight enhancements for an already good stacking model (Islam et al., 2024). The institution might be the right place to value those improvements, but a deployment decision would also need to make comparisons of support impacts, subgroup performance, transparency, and maintenance. The present tables give no indication of those costs or benefits and do not specify a preferred operating model.
The slight fold level stacking advantage shows how much a leaderboard is different than an evidence argument. A positive average contrast can be achieved with 6 wins and three ties, but does it necessarily justify the added complexity? On the other hand, if one fold-level is lost the model is not invalid. The important thing is that the comparison margin and the scope for evaluation are still visible. This interpretation is in line with studies that raise the issue of the non-universality of cross-validation variability as a measure of predictive uncertainty (Varoquaux, 2018).It also aligns with the utility of keeping the "easier" models that achieve similar performance that still have interpretable alternatives, not just the "hardest" models.
A related difference between evidential resolution and magnitude is uncovered in the explanation audit. The reported spreads do not dictate the relative order of the displayed central weights, and dominant weights in the problem-solved category and onsite participation. Several lower ranked features have positive central values with one spread envelopes going through or touching 0. These do not mean that these variables are not relevant. What it does imply, however, is that there is a decided hierarchy of educational priorities greater than that indicated by the summaries. The lack of independence between predictors and the perturbation distribution is another reason to not consider the marginal ranking as a single, unambiguous story of learning (Aas et al., 2021; Hooker et al., 2021).The cross-explainer comparison reinforces that feature importance is not a single measurement. Global absolute contributions and changes in predictive accuracy under permutation can emphasize different aspects of the fitted function. Comparing them requires a common explanation target, background population, and original-feature grouping. Their shared first two features provide descriptive agreement, but the remaining differences should be explored rather than averaged into an artificial consensus. Local or accumulated effect methods could add information about direction and heterogeneity in a future learner-level study; they cannot be reconstructed from the current table (Apley & Zhu, 2020; Lundberg et al., 2020).
The Bangladesh context changes how these findings should be used. A contest-participation feature may reflect both learning experience and the opportunity to participate. In this dataset, that possibility is an interpretation to investigate, not an estimated socioeconomic mechanism. Advising every student to increase contest participation without checking access, curriculum relevance, or preferred learning routes would move from prediction to an unsupported prescription. Educational bias research and lifecycle accounts of harm support inspecting the institutional conditions behind a proxy before allowing the proxy to determine access to support (Baker & Hawn, 2022; Suresh & Guttag, 2021)A stronger contribution for educational data mining is therefore to preserve the chain of meaning from response to representation to explanation. The audit makes that chain inspectable using published evidence while identifying where new data are essential. It complements, rather than replaces, human evaluation of explanations. An educator should be able to identify what a feature measures, why it appears in the model, how stable its displayed importance is, and which conclusions remain outside the evidence. Those requirements connect technical interpretability to educational relevance without claiming that an attractive explanation itself improves learning (Khosravi et al., 2022; Murdoch et al., 2019)
6. Implications for Bangladesh Higher Education
A good starting point is a feature dictionary that is both versioned and written for both analysts and educators. Each entry should include the original Bangla or English question, an agreed translated question (if necessary), allowed answers, missing value convention, constructed variable, and the earliest date available. Arbitrary numbers should not be placed in an informal response to complete a model input matrix. The cardinality findings of the audit itself specifically warrant review of high cardinality string features, and documentation of any aggregation back to its original educational construct.
Predictor selection should be performed after target definitions. It may be helpful to use a current status classification based on grades and behaviors, but it should be a descriptive current status. A prospective outcome (e.g., a subsequent independently judged programming task) must be based upon predictors measured prior to the assessment, and an evaluation cohort that is not part of the definition or tuning of the scoring rule. The metadata results are of particular relevance to the issue of reusing data that is shared publicly from Bangladesh surveys; this does not imply or imply that surveys whose metadata are not available should not be used for descriptive purposes (Prama, 2024; Rahman et al., 2024).
Institutional pilot should be conducted without impacting grades, scholarships or disciplinary actions. Predictions/explanations can be compared to later results, teacher judgements and pupils' accounts of their learning needs. Validation should assess: cohort differences, coverage of categories, probability calibration (if probabilities are used), and impact of supporting a finite number of support appointments. These current aggregate tables lack the ability to reliably determine an operational threshold, or identify which student groups would be best served (Guo et al., 2017; Van Calster et al., 2019).
Student-facing explanations should be different from observed pattern from diagnosis or instructions. Rather than repeating the sentiment that low contest participation results in weak programming, an adviser might consider the accuracy of the recorded category, and the value of an accessible practice opportunity. Students must have a way to alter their records and also challenge interpretations. This approach is based on the evidence boundaries presented here and the general argument of educator-led and inclusive education with AI (Miao et al., 2021; Zawacki-Richter et al., 2019).
The course of action that is proposed is not only to be evaluated, but also supported. An explanation-informed advising process would be compared to current advising to determine if it alters participation, learning, burden, and/or access. Such an evaluation should be designed independently of the classifier comparison. The present manuscript provides an audit framework along with reproducible evidence transformations, but does not provide evidence of the effectiveness of an intervention that is yet to occur (Kabudi et al., 2021).
7. Limitations and Future Research
The quantitative evidence is from a published case study on programming-skills in Bangladesh. The multiple tables, classifiers, folds and explanation tools are not independent institutional replications. The selected corpus is not meant to be a comprehensive snapshot of the period between 2017 and 2024 but provides conceptual and methodological context for the broader literature. The time limit is not for an approved 8-year student panel, it is for publication versions. The aggregate tables do not recover collection dates, institution follow-up weights, or longitudinal follow-up.
Another limitation is the transcription from parsed publisher text. Narrative cross-checks and automated consistency checks do not supersede a visual check of each cell of the original table. The source PDF could not be rendered through the retrieval interface and so the package thus contains exact table identifiers to allow for independent verification. Published feature cardinalities may be a result of inconsistencies in the wording or in the preprocessing of the text, which cannot be recovered here. Consequently, encoding dimensions is therefore dependent on the reported metadata, and explicit indicator conventions, not on measurements of the original design matrices.
No raw outcomes or predictions or frequencies of categories or training artefacts were provided to fit and audit a new model. The analysis is unable to determine the original leakage status, evaluate synthetic records, estimate class specific calibration, determine subgroup fairness and create post-hoc explanations. The values ± in front of the weights of the permutations are not fully specified in terms of meaning: the envelope analysis does not assign confidence levels to these. The results it provides are about the sensitivity to a selected multiplier, and not robustness to new students, new institutions, new distribution shift.
Last, but not least, the dataset-record audit is related to documentation, not to the underlying workbooks. No comparison is made numerically with those datasets and it is not known if there is any overlap. Future research needs to secure (appropriately governed) student-level records, freeze feature definitions and time cutoffs, make comparisons between semantically justified encodings in nested validation, and compare explanations across correlated feature groups. There should be cross-institution and future-cohort tests before an educator and student evaluation of the usefulness of the outcomes. The impact of acting on an explanation on learning outcomes can only be determined by an intervening design.
8. Conclusion
Feature engineering and interpretability are not distinct but related aspects of educational data mining. In the specific Bangladesh example, mixed encoding leads to a smaller feature space than full one-hot encoding, and typically results in better results when comparing published accuracy across classifiers, with some being tied with the random forest. The Fold-level results suggest that there is a minor stacking advantage, and the results of the interpretation audit reveal that the positive weights of the features are not synonymous with the stable and actionable explanations. The contribution is an audit, which preserves table-specific evidence, tests reporting sensitivity and identifies limits of inference, and is reproducible. Its short-term utility for higher education in Bangladesh is methodological, in that it will help to identify the target, to maintain feature meaning, to assess explanations explicitly, and to leave support decisions open to the educator and student. These findings do not support deployment or claims of improved learning until validated and used for intervention on the student level.
Data Availability Statement
All numerical inputs analyzed in this study are transcribed from Tables 2, 3, 13, 15, and 16 of Islam et al. (2024). The accompanying package contains source-coded CSV files, derived results, analysis code, and checksums. The two Mendeley records were used for metadata review only; their learner-level files were not analyzed. Original sources and persistent identifiers are listed in Table 1 and the references. A permanent repository for the present analysis package should be assigned by the authors before submission.
Ethics Statement
The study analyzes published aggregate results and public repository descriptions. It involved no direct recruitment, contact with students, or access to identifiable learner records. This statement describes the work performed and does not claim an institutional ethics exemption. The submitting authors should confirm any institution-specific review requirements.
Author Contributions, Funding, and Competing Interests
Author identities, CRediT roles, funding information, competing-interest declarations, and any journal-required AI-assistance disclosure must be completed and verified by the submitting authors. No author, funder, ethics approval, or absence of competing interests has been assumed.
References
- Aas, K., Jullum, M., & Løland, A. (2021). Explaining individual predictions when features are dependent: More accurate approximations to Shapley values. Artificial Intelligence, 298, 103502. https://doi.org/10.1016/j.artint.2021.103502
- Apley, D. W., & Zhu, J. (2020). Visualizing the effects of predictor variables in black box supervised learning models. Journal of the Royal Statistical Society: Series B (Statistical Methodology), 82(4), 1059–1086. https://doi.org/10.1111/rssb.12377
- Baker, R. S., & Hawn, A. (2022). Algorithmic bias in education. International Journal of Artificial Intelligence in Education, 32, 1052–1092. https://doi.org/10.1007/s40593-021-00285-9
- Guo, C., Pleiss, G., Sun, Y., & Weinberger, K. Q. (2017). On calibration of modern neural networks. Proceedings of the 34th International Conference on Machine Learning, Proceedings of Machine Learning Research, 70, 1321–1330. https://proceedings.mlr.press/v70/guo17a.html
- Hooker, G., Mentch, L., & Zhou, S. (2021). Unrestricted permutation forces extrapolation: Variable importance requires at least one more model, or there is no free variable importance. Statistics and Computing, 31, 82. https://doi.org/10.1007/s11222-021-10057-z
- Islam, M. R., Nitu, A. M., Marjan, M. A., Uddin, M. P., Afjal, M. I., & Mamun, M. A. A. (2024). Enhancing tertiary students’ programming skills with an explainable Educational Data Mining approach. PLOS ONE, 19(9), e0307536. https://doi.org/10.1371/journal.pone.0307536
- Kabudi, T., Pappas, I., & Olsen, D. H. (2021). AI-enabled adaptive learning systems: A systematic mapping of the literature. Computers and Education: Artificial Intelligence, 2, 100017. https://doi.org/10.1016/j.caeai.2021.100017
- Kapoor, S., & Narayanan, A. (2023). Leakage and the reproducibility crisis in machine-learning-based science. Patterns, 4(9), 100804. https://doi.org/10.1016/j.patter.2023.100804
- Khosravi, H., Buckingham Shum, S., Chen, G., Conati, C., Tsai, Y.-S., Kay, J., Knight, S., Martinez-Maldonado, R., Sadiq, S., & Gašević, D. (2022). Explainable artificial intelligence in education. Computers and Education: Artificial Intelligence, 3, 100074. https://doi.org/10.1016/j.caeai.2022.100074
- Lipton, Z. C. (2018). The mythos of model interpretability. Communications of the ACM, 61(10), 36–43. https://doi.org/10.1145/3233231
- Lundberg, S. M., & Lee, S.-I. (2017). A unified approach to interpreting model predictions. Advances in Neural Information Processing Systems, 30, 4765–4774. https://proceedings.neurips.cc/paper_files/paper/2017/hash/8a20a8621978632d76c43dfd28b67767-Abstract.html
- Lundberg, S. M., Erion, G., Chen, H., DeGrave, A., Prutkin, J. M., Nair, B., Katz, R., Himmelfarb, J., Bansal, N., & Lee, S.-I. (2020). From local explanations to global understanding with explainable AI for trees. Nature Machine Intelligence, 2, 56–67. https://doi.org/10.1038/s42256-019-0138-9
- Marjan, M. A., Uddin, M. P., & Afjal, M. I. (2023). An educational data mining system for predicting and enhancing tertiary students’ programming skill. The Computer Journal, 66(5), 1083–1101. https://doi.org/10.1093/comjnl/bxab214
- Miao, F., Holmes, W., Huang, R., & Zhang, H. (2021). AI and education: Guidance for policy-makers. UNESCO. https://doi.org/10.54675/PCSP7350
- Murdoch, W. J., Singh, C., Kumbier, K., Abbasi-Asl, R., & Yu, B. (2019). Definitions, methods, and applications in interpretable machine learning. Proceedings of the National Academy of Sciences, 116(44), 22071–22080. https://doi.org/10.1073/pnas.1900654116
- Prama, T. T. (2024). Dataset on academic performance of computer science students at selected universities in Bangladesh (Version 2) [Data set]. Mendeley Data. https://doi.org/10.17632/ns87rtkv58.2
- Rahman, A. T., Lamia, S., Shishir, A. H., & Barsa, M. M. (2024). Students_Academic_ Performance_Evaluation_Dataset (Version 1) [Data set]. Mendeley Data. https://doi.org/10.17632/dc3797vf3t.1
- Romero, C., & Ventura, S. (2020). Educational data mining and learning analytics: An updated survey. WIREs Data Mining and Knowledge Discovery, 10(3), e1355. https://doi.org/10.1002/widm.1355
- Rudin, C. (2019). Stop explaining black box machine learning models for high stakes decisions and use interpretable models instead. Nature Machine Intelligence, 1, 206–215. https://doi.org/10.1038/s42256-019-0048-x
- Rudin, C., Chen, C., Chen, Z., Huang, H., Semenova, L., & Zhong, C. (2022). Interpretable machine learning: Fundamental principles and 10 grand challenges. Statistics Surveys, 16, 1–85. https://doi.org/10.1214/21-SS133
- Slack, D., Hilgard, S., Jia, E., Singh, S., & Lakkaraju, H. (2020). Fooling LIME and SHAP: Adversarial attacks on post hoc explanation methods. Proceedings of the AAAI/ACM Conference on AI, Ethics, and Society, 180–186. https://doi.org/10.1145/3375627.3375830
- Suresh, H., & Guttag, J. V. (2021). A framework for understanding sources of harm throughout the machine learning life cycle. Proceedings of the 1st ACM Conference on Equity and Access in Algorithms, Mechanisms, and Optimization, Article 17, 1–9. https://doi.org/10.1145/3465416.3483305
- Van Calster, B., McLernon, D. J., van Smeden, M., Wynants, L., & Steyerberg, E. W. (2019). Calibration: The Achilles heel of predictive analytics. BMC Medicine, 17, 230. https://doi.org/10.1186/s12916-019-1466-7
- Varoquaux, G. (2018). Cross-validation failure: Small sample sizes lead to large error bars. NeuroImage, 180, 68–77. https://doi.org/10.1016/j.neuroimage.2017.06.061
- Zawacki-Richter, O., Marín, V. I., Bond, M., & Gouverneur, F. (2019). Systematic review of research on artificial intelligence applications in higher education—Where are the educators?. International Journal of Educational Technology in Higher Education, 16, 39. https://doi.org/10.1186/s41239-019-0171-0
CITE THIS ARTICLE
Podder, S. (2026). Feature Engineering and Model Interpretability in Educational Data Mining. https://www.researchbysimanto.com/article/48a8beac-fd42-48ad-b5a0-8c133b637bfb
S. Podder, “Feature Engineering and Model Interpretability in Educational Data Mining,” 2026. [Online]. Available: https://www.researchbysimanto.com/article/48a8beac-fd42-48ad-b5a0-8c133b637bfb
Podder, S. (2026) ‘Feature Engineering and Model Interpretability in Educational Data Mining’. Available at: https://www.researchbysimanto.com/article/48a8beac-fd42-48ad-b5a0-8c133b637bfb
Podder, Simanto. “Feature Engineering and Model Interpretability in Educational Data Mining.” 2026, https://www.researchbysimanto.com/article/48a8beac-fd42-48ad-b5a0-8c133b637bfb.
Simanto Podder. “Feature Engineering and Model Interpretability in Educational Data Mining.” (2026). https://www.researchbysimanto.com/article/48a8beac-fd42-48ad-b5a0-8c133b637bfb.
Podder S. Feature Engineering and Model Interpretability in Educational Data Mining. 2026. https://www.researchbysimanto.com/article/48a8beac-fd42-48ad-b5a0-8c133b637bfb
@misc{article_48a8beacfd4248adb5a08c133b637bfb,
  title = {Feature Engineering and Model Interpretability in Educational Data Mining},
  author = {Simanto Podder},
  year = {2026},
  url = {https://www.researchbysimanto.com/article/48a8beac-fd42-48ad-b5a0-8c133b637bfb},
}
TY - GEN AU - Simanto Podder TI - Feature Engineering and Model Interpretability in Educational Data Mining PY - 2026 UR - https://www.researchbysimanto.com/article/48a8beac-fd42-48ad-b5a0-8c133b637bfb ER -